Fork for Amazon series data
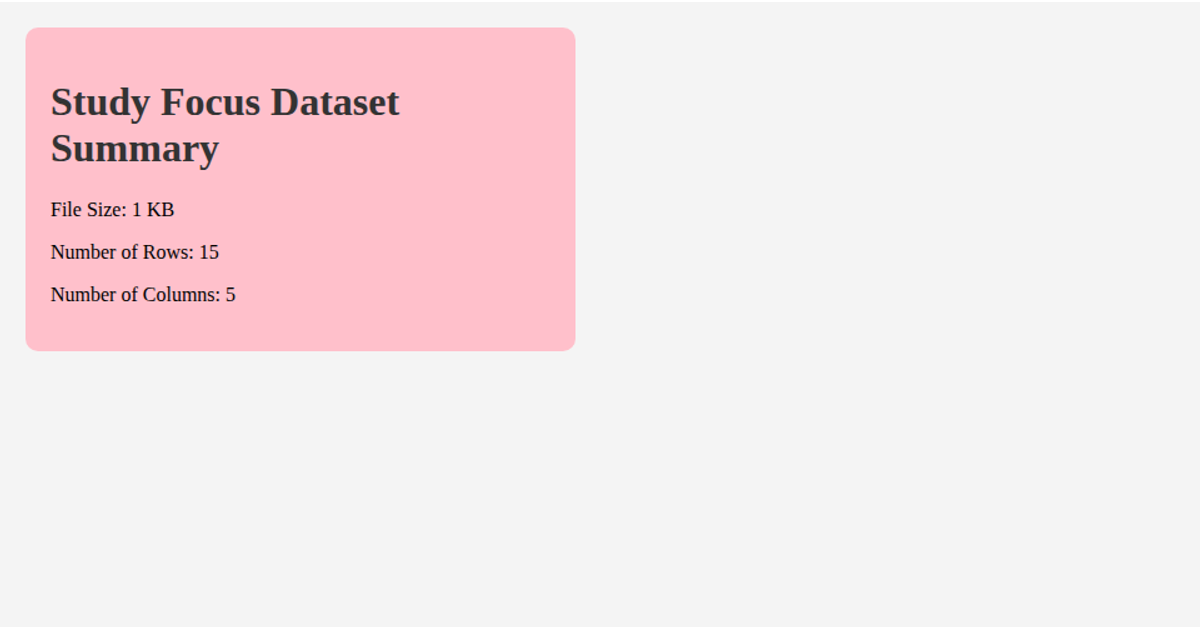
This example visualizes metadata about Amazon series data loaded from a CSV file, displaying summary statistics such as data length, row count, and column count. It renders a simple cartoon face as a decorative SVG element alongside the text summary. The code uses React hooks (`useState`, `useEffect`, `useCallback`) to manage asynchronous data loading via D3’s `csv` function, and formats the output using `csvFormat`. The SVG face is built with basic shapes like circles, polygons, and rectangles, styled with inline objects. The data source is a remote GitHub-hosted CSV, and the visualization is presented as a static, non-interactive layout.
AI-generated descriptionA program that loads in some data about CSS named colors using D3 utilities, and uses React state to keep track of the data.





Comments
Sign in to join the discussion.