🌍 Public
Fork of Car Selling Details - Vega Lite
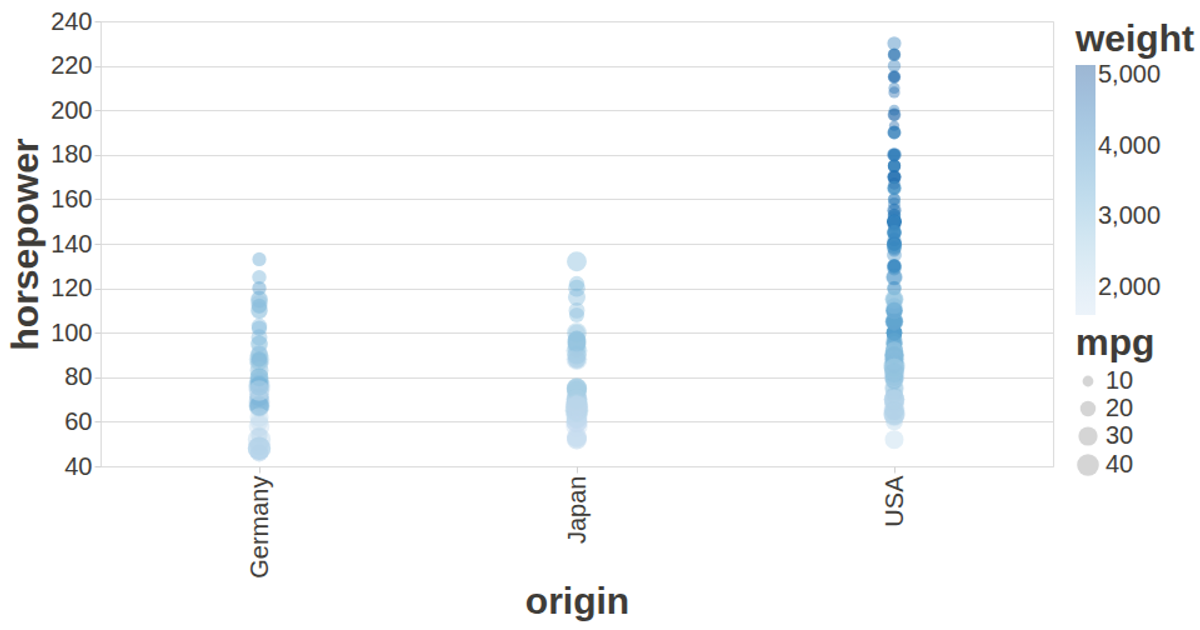
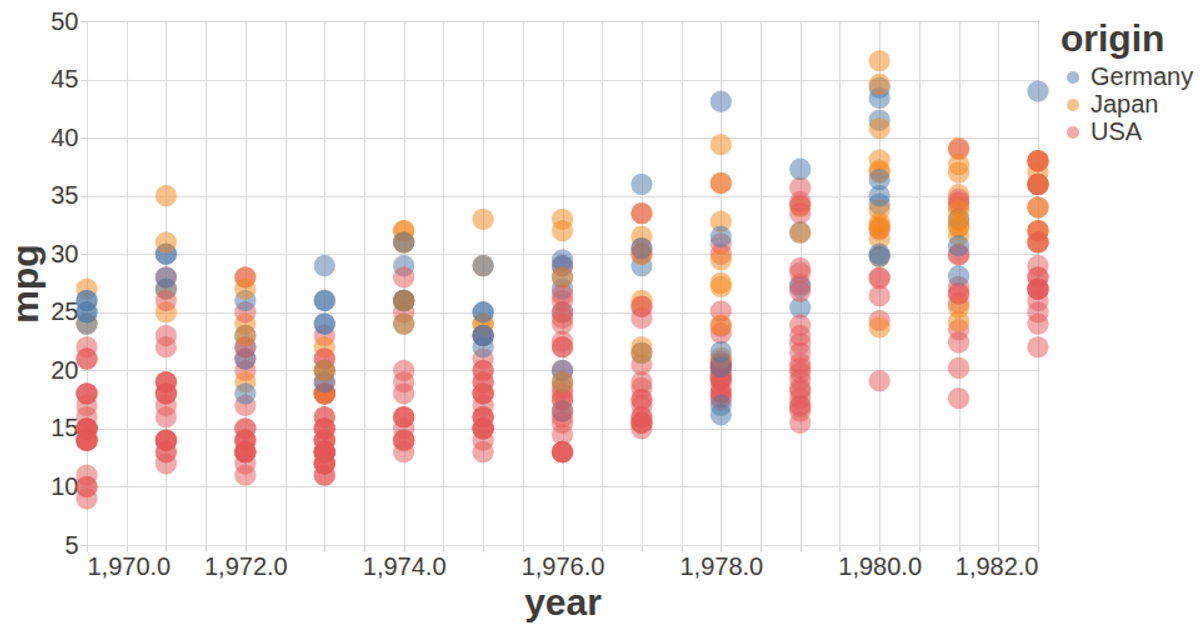
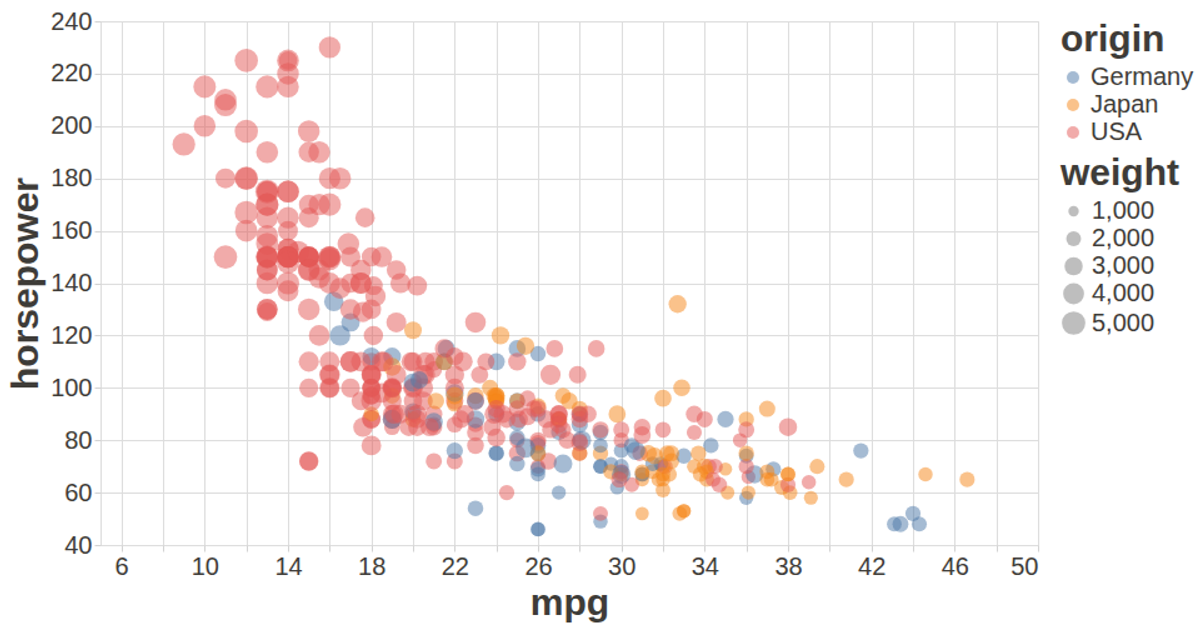
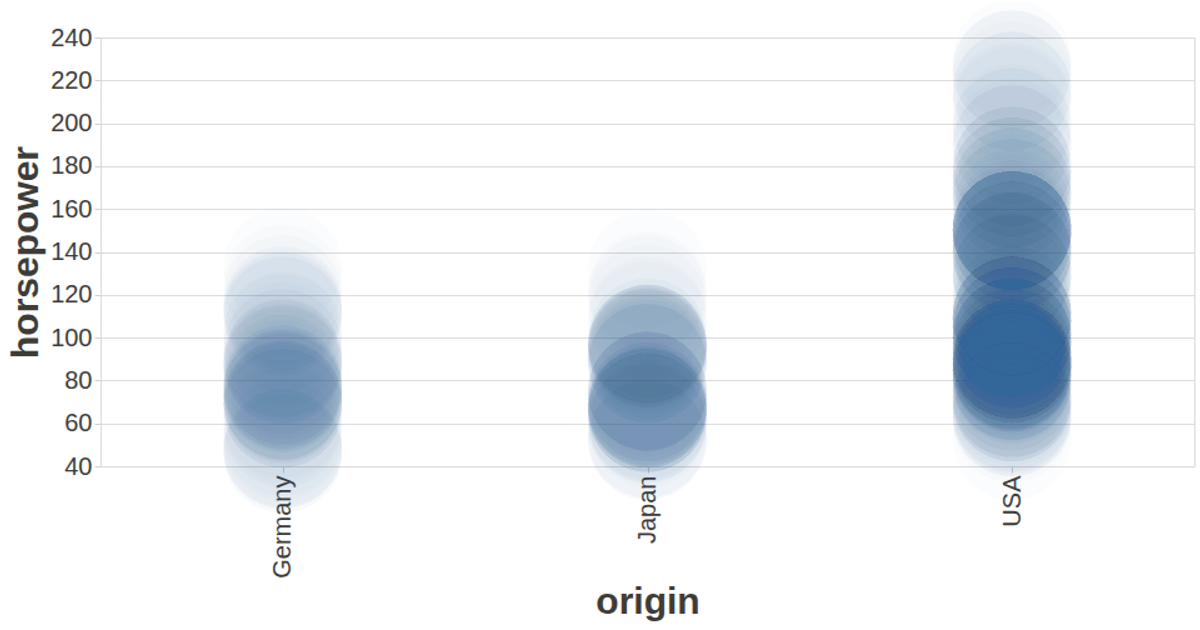
This visualization presents the production year of cars from the UCI Auto MPG dataset as a circular donut chart. It uses the Vega-Lite API to map the year field to both the angular position (theta) and color of each arc, with years grouped into five-year bins. The view is rendered to a canvas and supports tooltips via the vega-tooltip handler. The visualization uses a custom configuration to enhance readability, including specific font sizes and colors for labels and titles. The chart dynamically resizes to fit the browser window.
AI-generated descriptionA visualization constructed using the vega-lite-api.
The data shown here comes from the UCI Machine Learning Repository: Auto MPG Data Set, via Gist: Scatter Plot with Menus.
MIT Licensed




Comments
Sign in to join the discussion.