🌍 Public
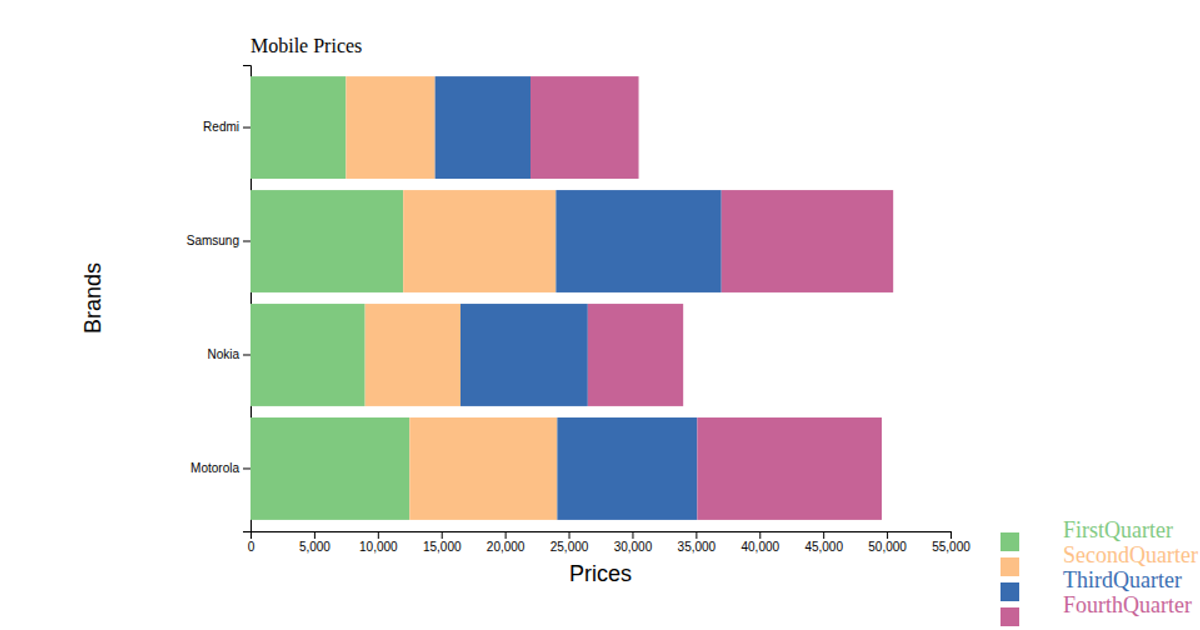
Mobile Inventory stacked bar chart
This example shows mobile inventory counts for three brands—Samsung, OnePlus, and Motorola—broken into Mobile, Tablet, and Earpods categories using a stacked bar chart. Each bar segments three colored rectangles (pink, yellow, red) representing the product types, with axis labels and a legend to the right. The code uses D3 v7 via UNPKG, building the visualization with `d3.scaleBand`, `d3.scaleLinear`, and `d3.axisBottom`/`d3.axisLeft` in an SVG. The dataset is hardcoded in the script, and the legend maps each color to its corresponding value name.
AI-generated descriptionAn example showing the capabilities of VizHub:
- Loads D3 via UNPKG.
- Demonstrates use of
importfrom"d3". - Demonstrates use of
importfrom local ES6 modules.
MIT Licensed




Comments
Sign in to join the discussion.