🌍 Public
ScatterPlot by Sidd
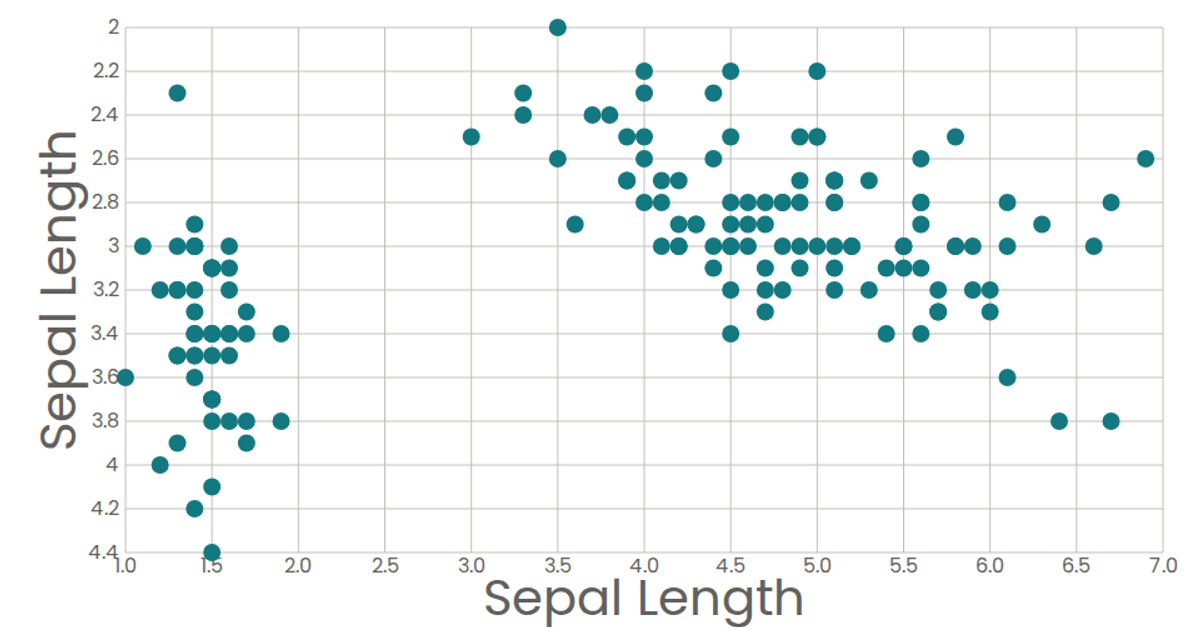
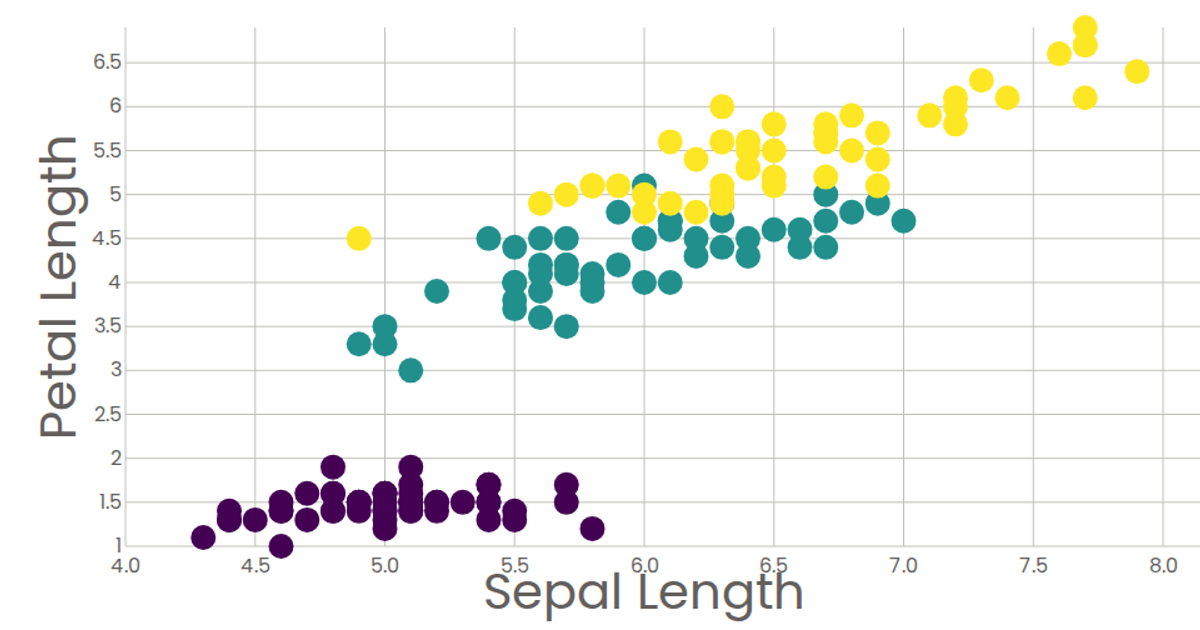
This visualization is a scatter plot of the Iris dataset, showing the relationship between sepal width and petal length. It uses React and d3.v5 to render SVG circles, with axes and tick marks created by custom components. The plot reads data from a CSV file using d3’s `csv` function and scales the points with `scaleLinear` and `extent`. Tooltips display formatted values via SVG `<title>` elements, and the chart is fully responsive within its 960x500 viewBox.
AI-generated descriptionSmiley face implementation with React & D3.
MIT Licensed




Comments
Sign in to join the discussion.