🌍 Public
KR - DV - ICE5
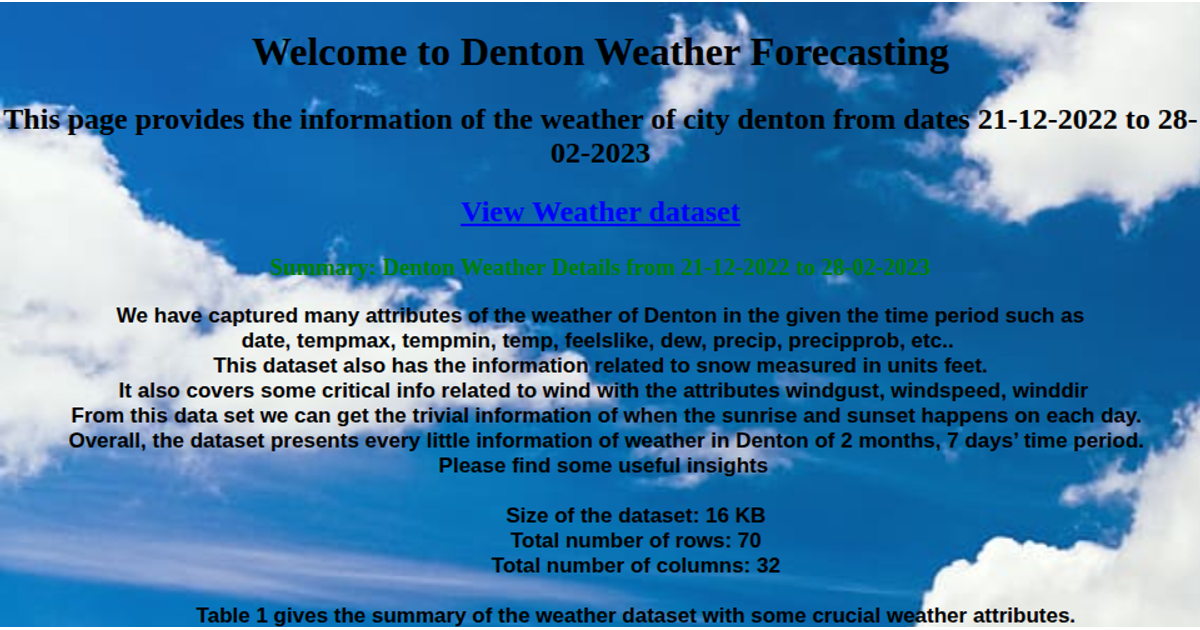
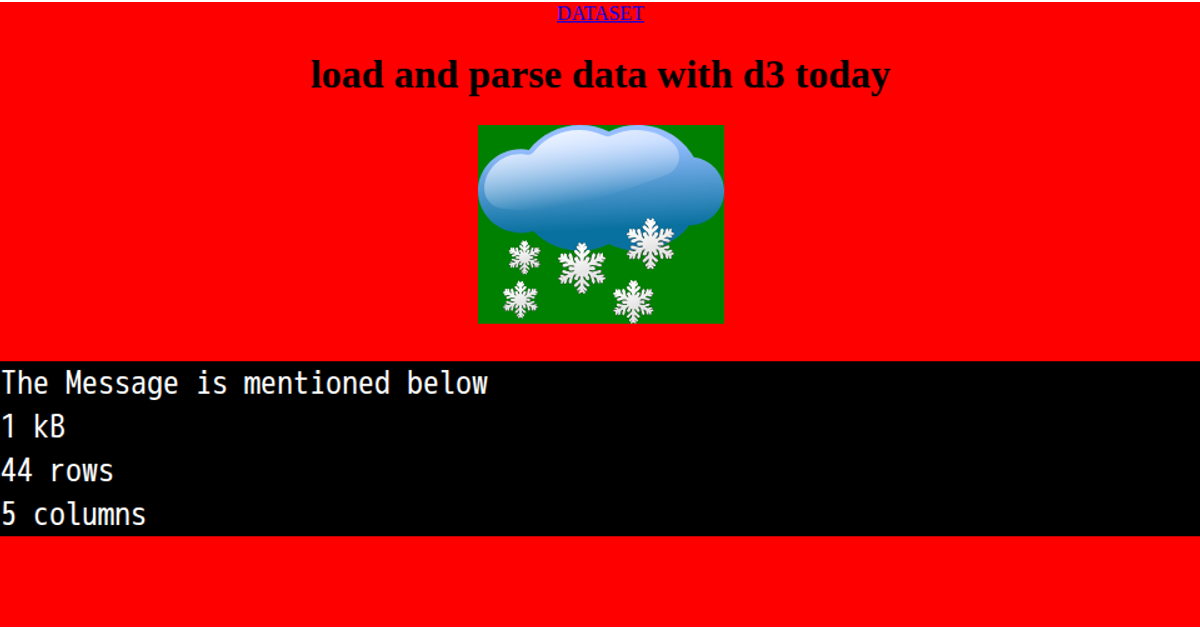
This example displays a summary of Denton weather data from December 2022 to February 2023, presenting descriptive statistics for attributes such as temperature, humidity, precipitation, and wind speed. The page uses D3.js (v7) to load a CSV file via `d3.csv`, convert string values to numbers, and compute minimum, maximum, mean, median, and standard deviation for each attribute using `d3.min`, `d3.max`, `d3.mean`, `d3.median`, and `d3.deviation`. Results populate an HTML table alongside a text summary, with a weather-themed background image applied through CSS.
AI-generated descriptionCreating a dataset and develop a webpage to summarize that dataset using D3 JS.
MIT Licensed





Comments
Sign in to join the discussion.