🌍 Public
Line Chart
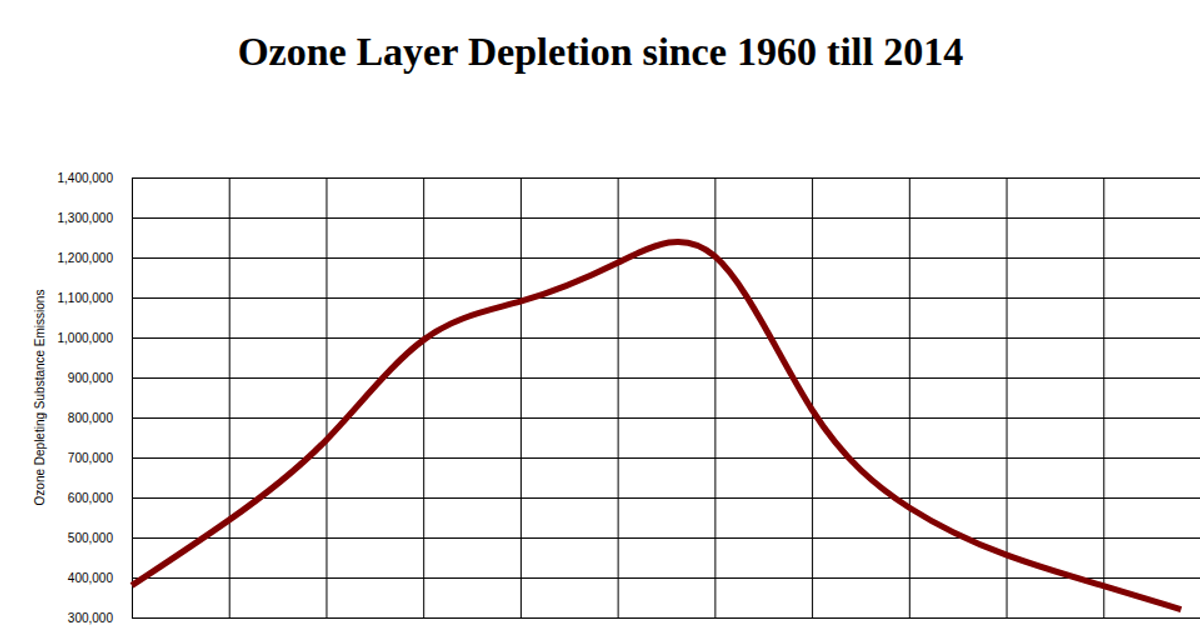
This line chart shows the depletion of ozone-depleting substance emissions from 1960 to 2014, with year on the x-axis and emission levels on the y-axis. The visualization uses React and D3 v5, employing d3.csv to load the dataset, scaleLinear for both axes, and d3.line with curveBasis to generate a smooth purple path. Axis labels and a title are added via d3.axisBottom, d3.axisLeft, and SVG text elements within a 1000x500 SVG.
AI-generated descriptionA bare minimum HTML page demonstrating use of CSS and JavaScript.
See also React Starter.
MIT Licensed



Comments
Sign in to join the discussion.