🌍 Public
Assignment ICE-6 Bar Graph
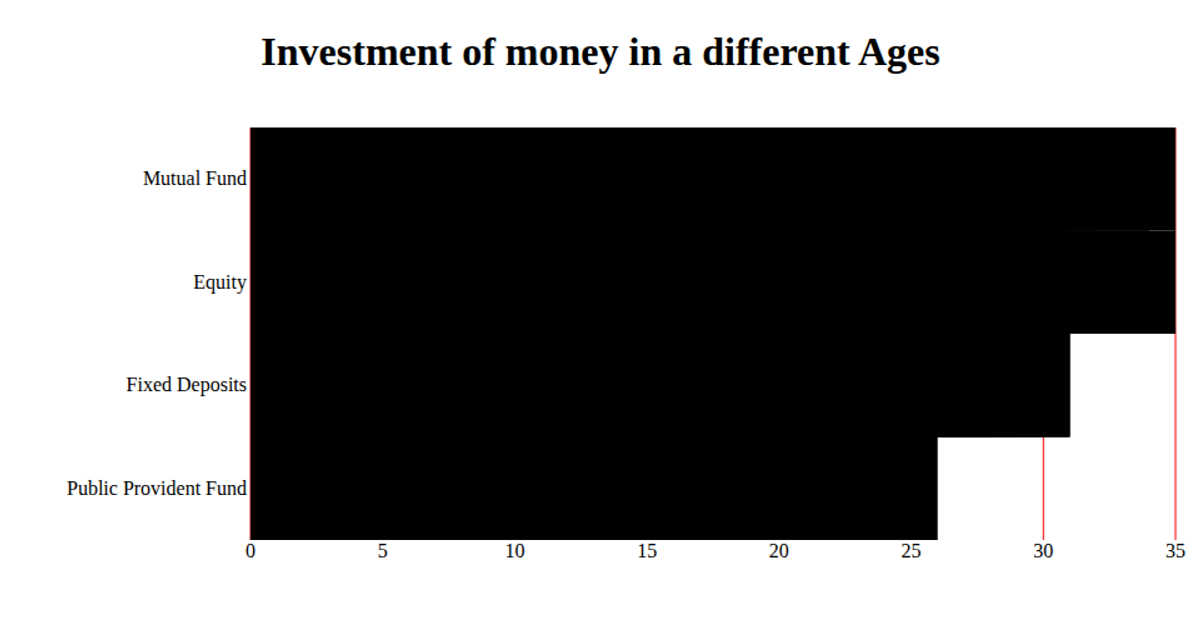
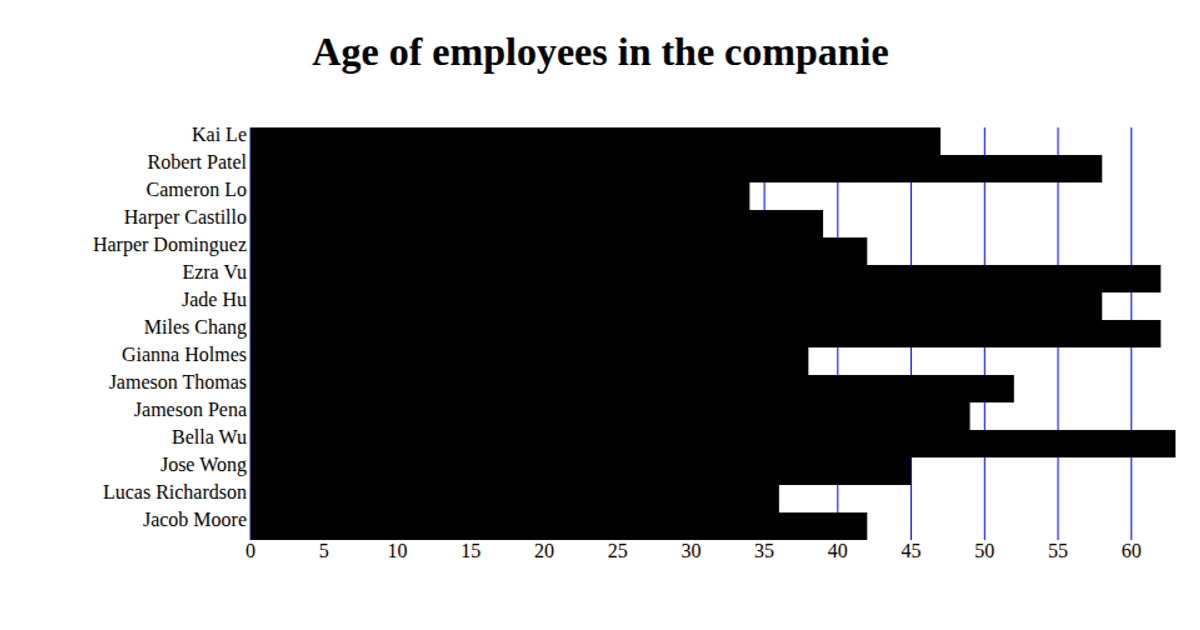
This bar chart visualizes the investment of money across different ages, comparing values for twelve countries using a horizontal layout. It loads CSV data from a GitHub gist and renders an SVG with React, using D3 v5 scales (`scaleBand` for the y-axis, `scaleLinear` for the x-axis). The code draws gridlines, tick labels, and rectangles for each bar, with axis positioning handled through SVG transforms and D3’s axis utilities.
AI-generated descriptionA whole smiley face
MIT Licensed




Comments
Sign in to join the discussion.