🌍 Public
ICE_8
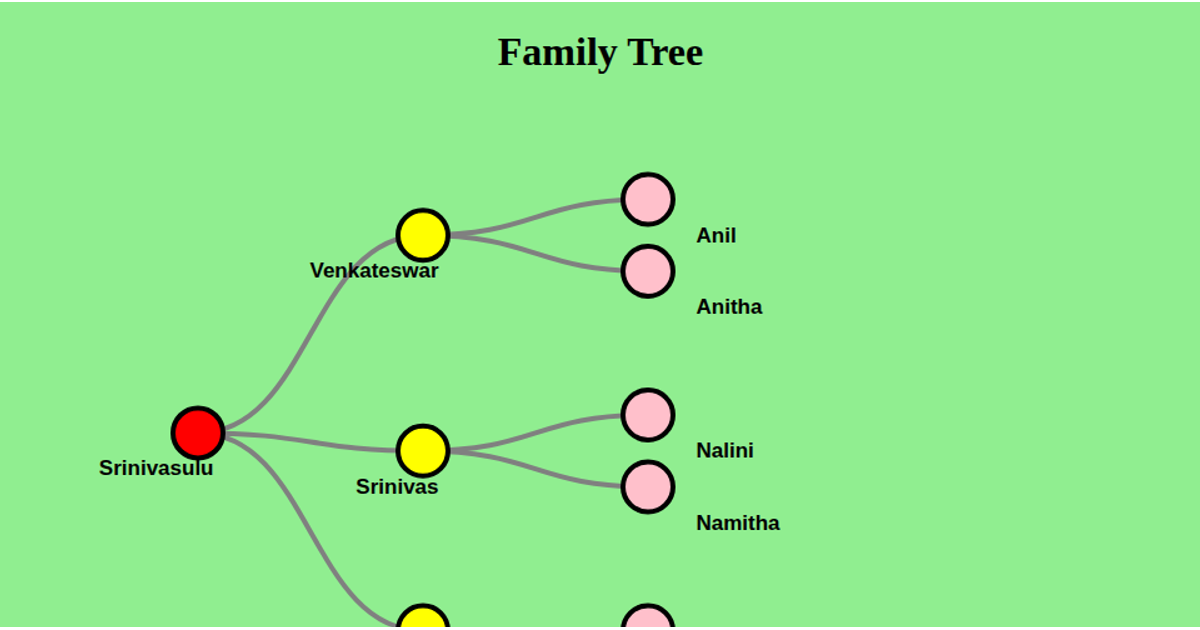
An interactive SVG tree diagram visualizes a family lineage from Srinivasarao down through multiple generations. The chart uses animated transitions: clicking a node collapses or expands its children, moving nodes along curved diagonal paths. Built with D3.js (version 3.5.17), it employs the `d3.layout.tree` for node positioning and `d3.svg.diagonal` for link paths. Nodes appear as circles with labels, while expanding nodes turn red to indicate collapsed state. The demo displays static sample data embedded in the JavaScript, with all styling defined in embedded CSS.
AI-generated descriptionA bare minimum HTML page demonstrating use of CSS and JavaScript. .
MIT Licensed


Comments
Sign in to join the discussion.