🌍 Public
activity7_question2
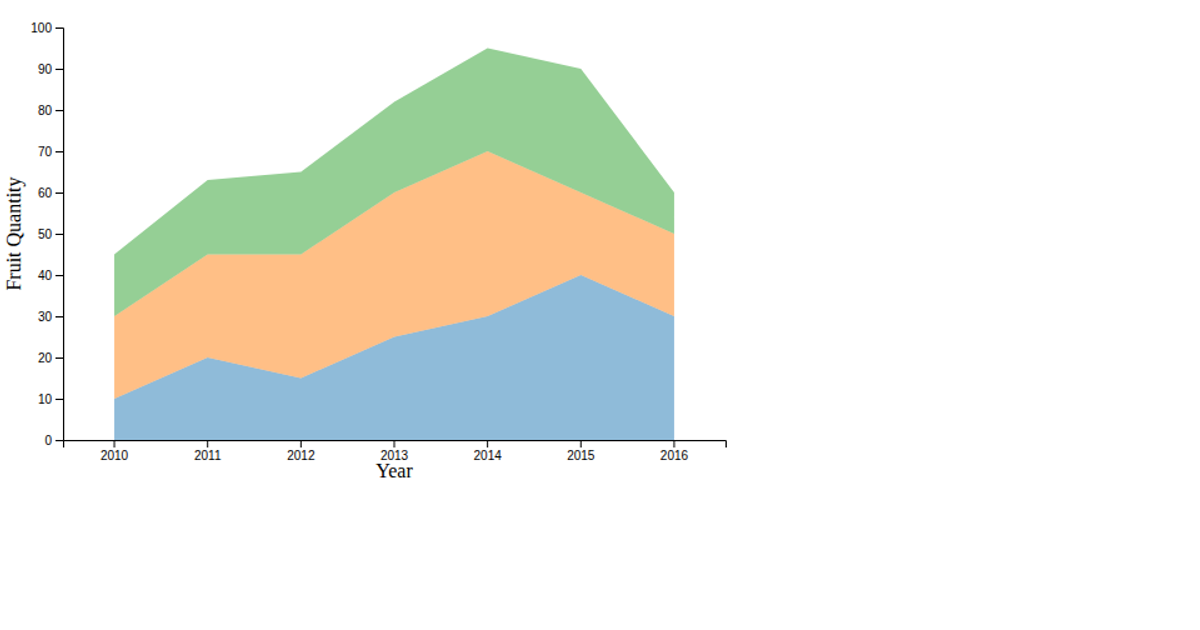
This example shows AI adoption in agriculture by continent from 2010 to 2024 using layered filled areas. The visualization uses d3.csv to load data from a GitHub gist, then draws six stacked area paths with d3.area, colored by region. It employs d3.scaleLinear for x and y axes, d3.axisBottom and d3.axisLeft for tick marks, and a custom legend created with SVG rectangles and text. The chart is rendered entirely in SVG via d3.select, with styling applied directly through D3 attributes.
AI-generated descriptionMIT Licensed




Comments
Sign in to join the discussion.