🌍 Public
WORLD MAP DISPLAYING BOUNDARIES
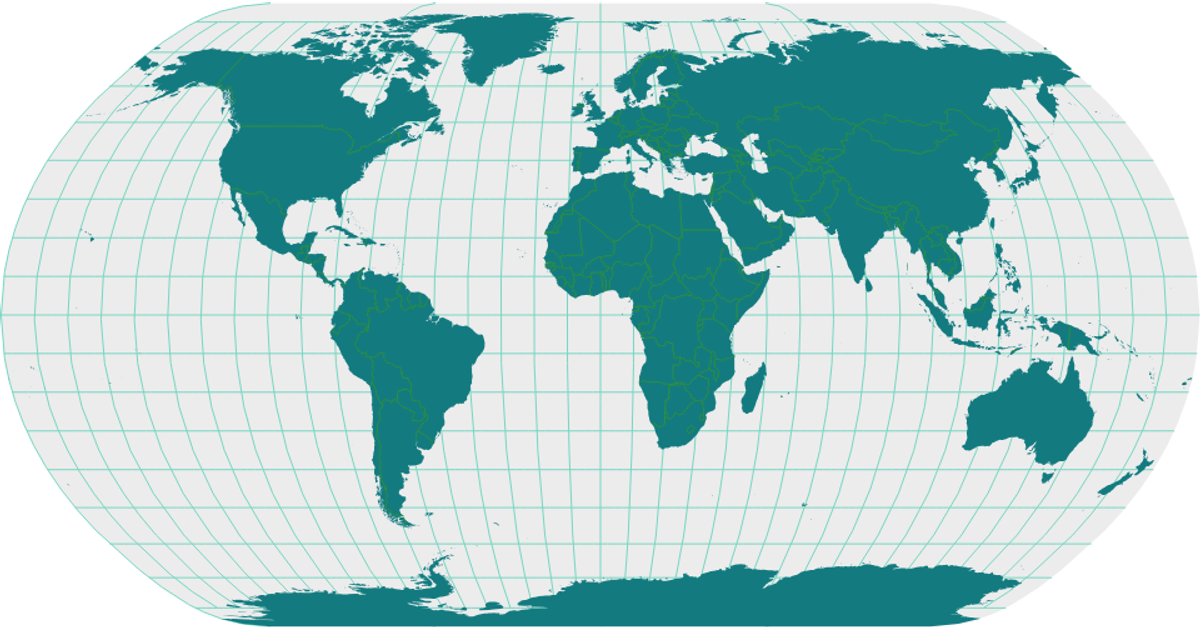
This visualization displays a world map with country boundaries, rendered as SVG paths using React and D3’s geoNaturalEarth1 projection and geoPath. It shows landmasses, graticules, and interior borders from the World Atlas TopoJSON, loaded via d3.json and processed with topojson’s feature and mesh. The map uses distinct colors for each layer, including yellow sphere, orange graticules, pink land, and red interiors.
AI-generated descriptionA world map showing country boundaries from World Atlas TopoJSON, polished for visual style, including graticules.
MIT Licensed



Comments
Sign in to join the discussion.