🌍 Public
World Countries Tree
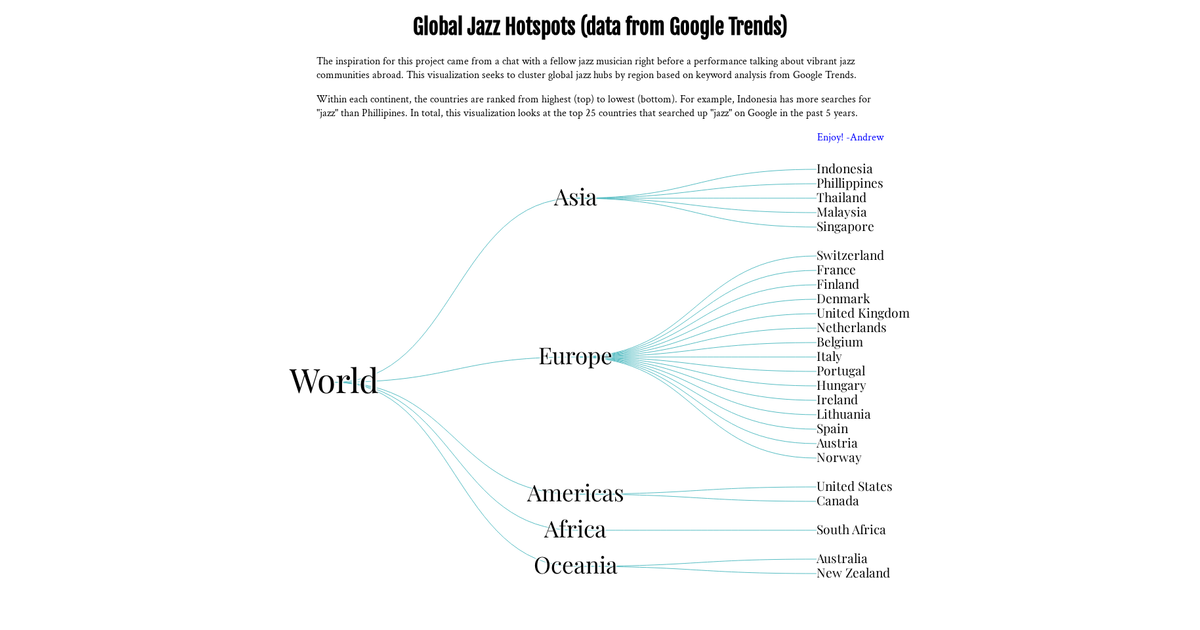
This example visualizes the popularity of the keyword "jazz" across 25 countries, grouped into continents, with each country ranked from highest to lowest search interest within its region. The hierarchical data is rendered as a tree using the D3.js library, specifically `d3.tree` and `hierarchy`, with `linkHorizontal` generating the curved connecting paths. Interactive zooming is enabled via `d3.zoom`, allowing users to pan and scale the network. The SVG output uses a distinct font styling and is driven by `data.json`, which contains the nested continent-country structure.
AI-generated descriptionMIT Licensed


Comments
Sign in to join the discussion.