🌍 Public
Fork of Choropleth Map
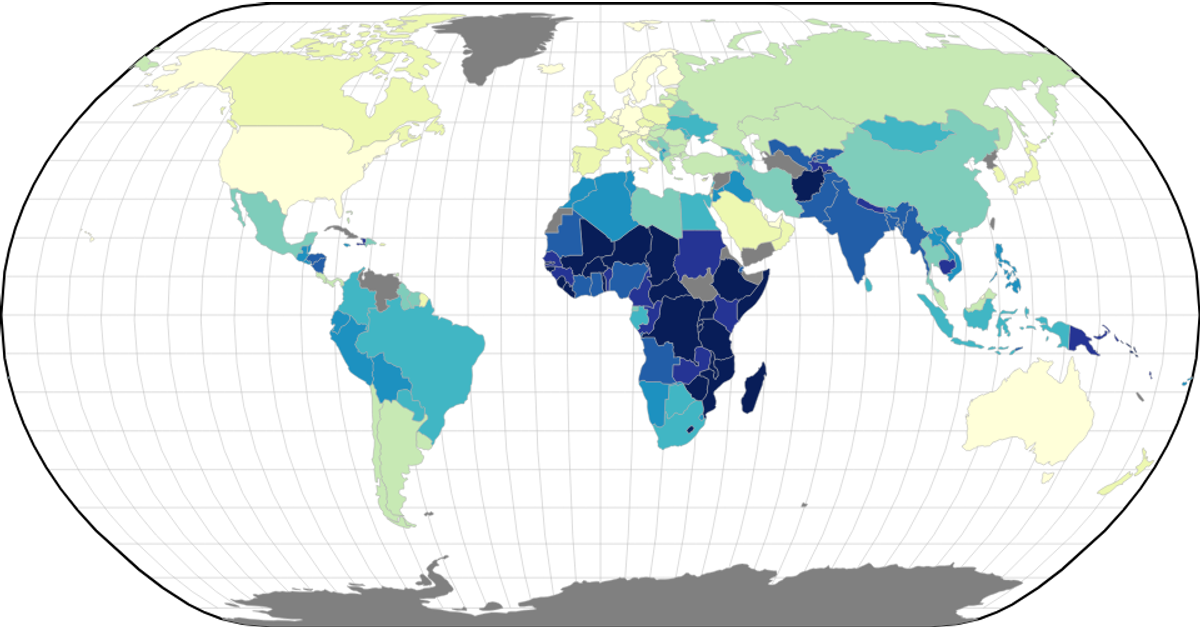
This choropleth map visualizes World Bank GDP per capita (PPP) data for 2020, assigning colors to countries based on their economic output. The map renders d3.geoPath shapes with a natural Earth projection and a YlGnBu color scheme, using a d3.scaleQuantile scale to bin the data into nine quantile-based classes. Countries missing data appear gray. The visualization fetches both a world atlas TopoJSON file and a CSV dataset via Promise.all, parsing the latter after skipping an initial header offset.
AI-generated descriptionA choropleth map of World Bank Dataset: GDP per capita, PPP (current international $).
See also:
- Wikipedia: List of countries by GDP (PPP)
- World Bank: GDP per capita, PPP (current international $)
- GitHub Gist: World Bank Dataset: GDP per capita, PPP (current international $)
- MDN: String.prototype.substring()
- MDN: Promise.all
- MDN: Map
- d3.scaleQuantile
- Wikipedia: Quantile
- d3-scale-chromatic
- ColorBrewer
MIT Licensed



Comments
Sign in to join the discussion.