🌍 Public
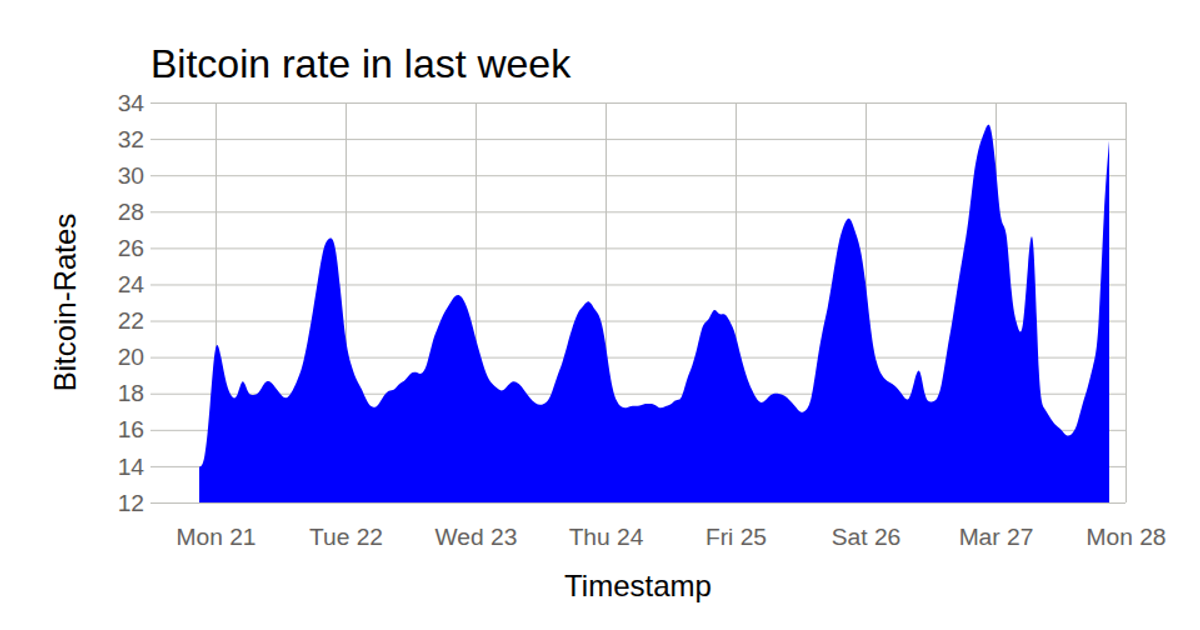
Fork of Bitcoin - Area Chart ICE-7
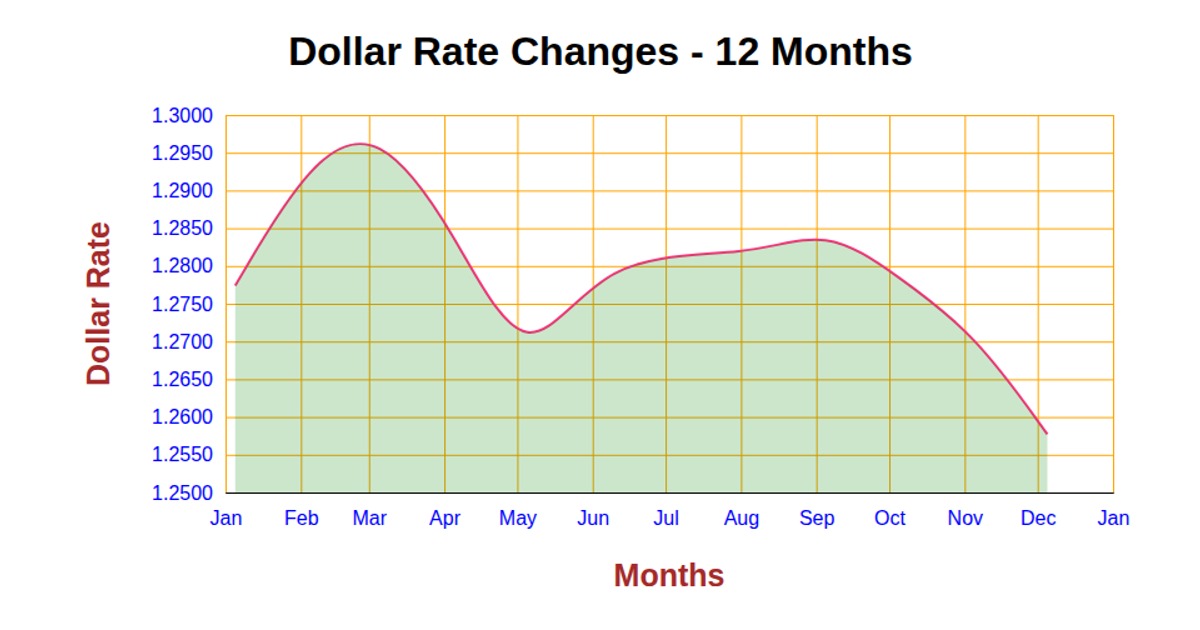
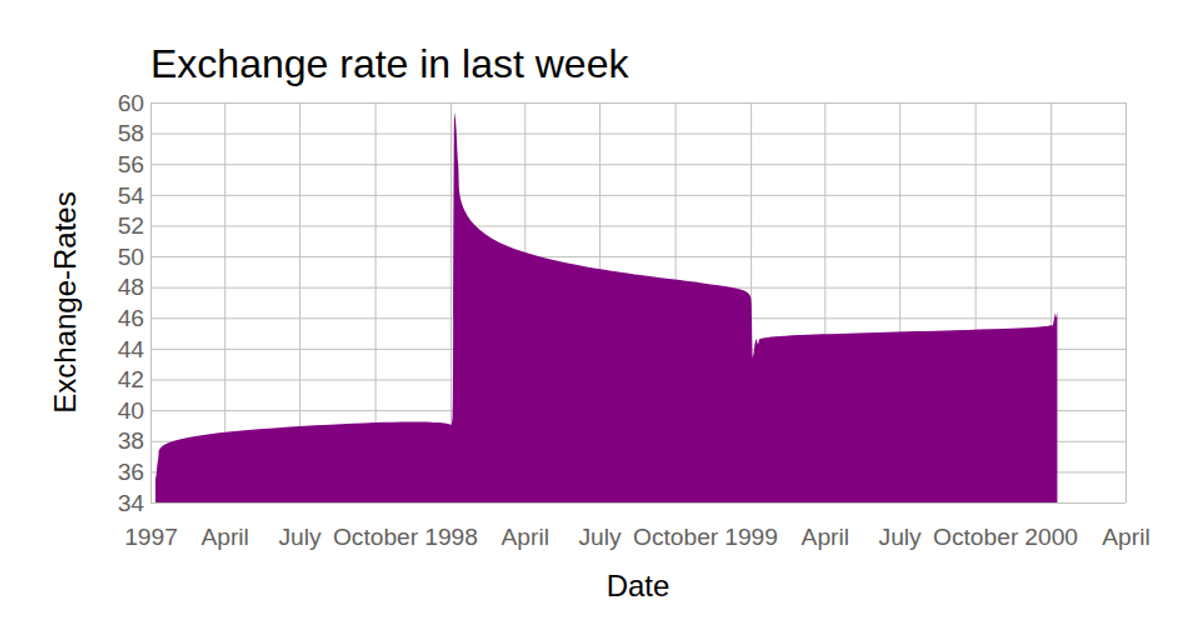
This area chart visualizes Bitcoin exchange rates over a week, with time on the x-axis and rate on the y-axis, using a smooth curveBasis path to connect data points from a CSV file. The SVG rendering uses d3.scaleTime, d3.scaleLinear, d3.axisLeft, and d3.axisBottom to build scales and axes, while d3.area generates the filled region beneath the line. The chart includes grid lines, axis labels, and a title, all styled with CSS.
AI-generated descriptionMIT Licensed




Comments
Sign in to join the discussion.