🌍 Public
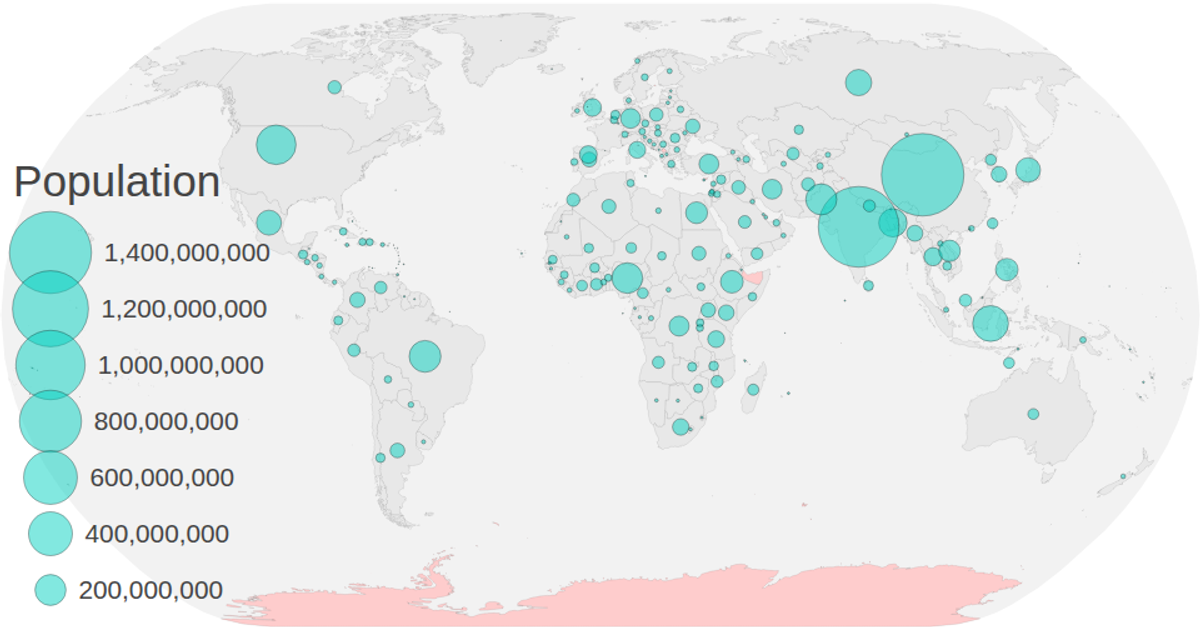
Danil Circles on a Map
Ssakhabutdinov
Last edited Mar 31, 2020
Created on Mar 27, 2020
Forked from Choropleth Map with Interactive Filtering
This visualization combines a choropleth map with proportional circles to display population data by country. The map uses d3.geoNaturalEarth1 projection and d3.geoPath to render world geography, while d3.scaleSqrt sizes circles at each country’s centroid based on 2018 population figures. A color legend built with d3.scaleOrdinal filters countries by economy type, and a size legend explains circle scaling. Users can zoom and pan via d3.zoom, with hover tooltips showing region names and population values.
AI-generated descriptionMIT Licensed



Comments
Sign in to join the discussion.