🌍 Public
Map learning process
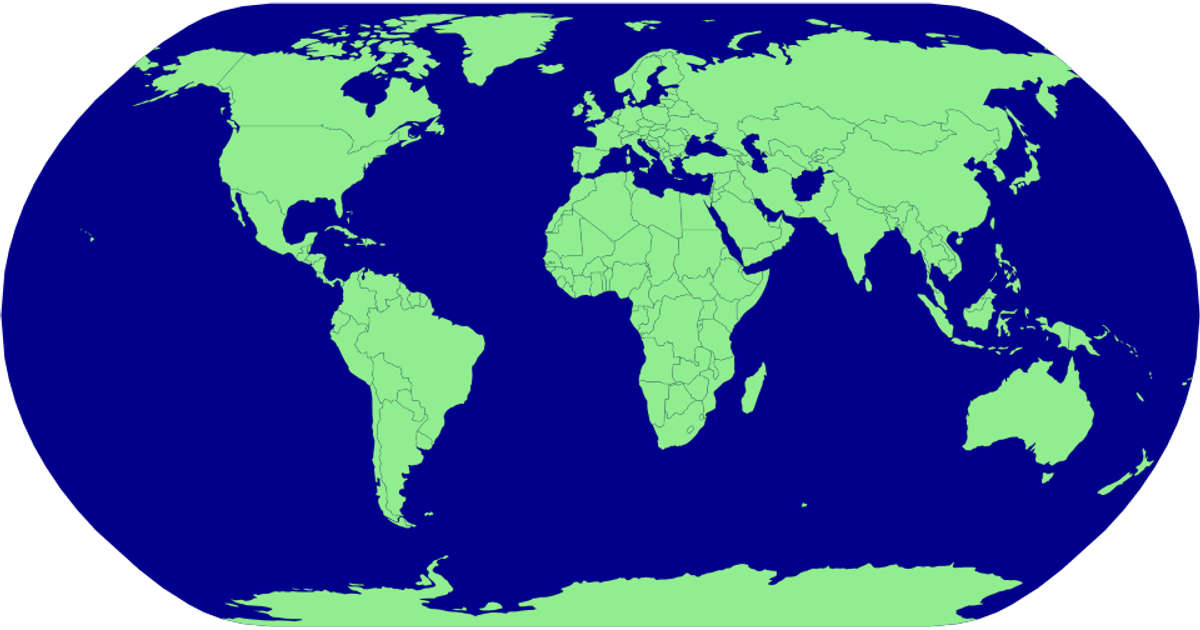
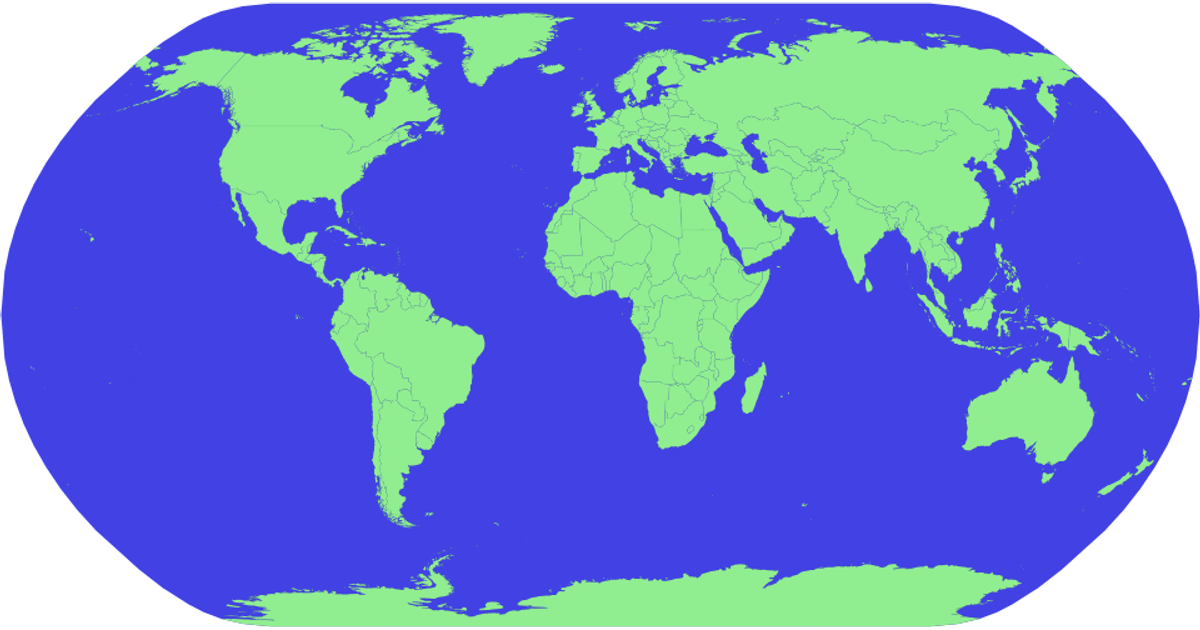
This example visualizes the world map using a natural Earth projection, displaying individual countries as light green polygons with thin black borders against a yellow sphere. The visualization fetches geographic data from the World Atlas TopoJSON dataset, then uses d3.json to load it and topojson.feature to convert the TopoJSON topology into GeoJSON features. The rendering relies on d3.geoPath and d3.geoNaturalEarth1 to project and draw the countries as SVG paths, with the sphere background created manually via d3.geoPath.
AI-generated descriptionMIT Licensed



Comments
Sign in to join the discussion.