🌍 Public
ICE5-Q2
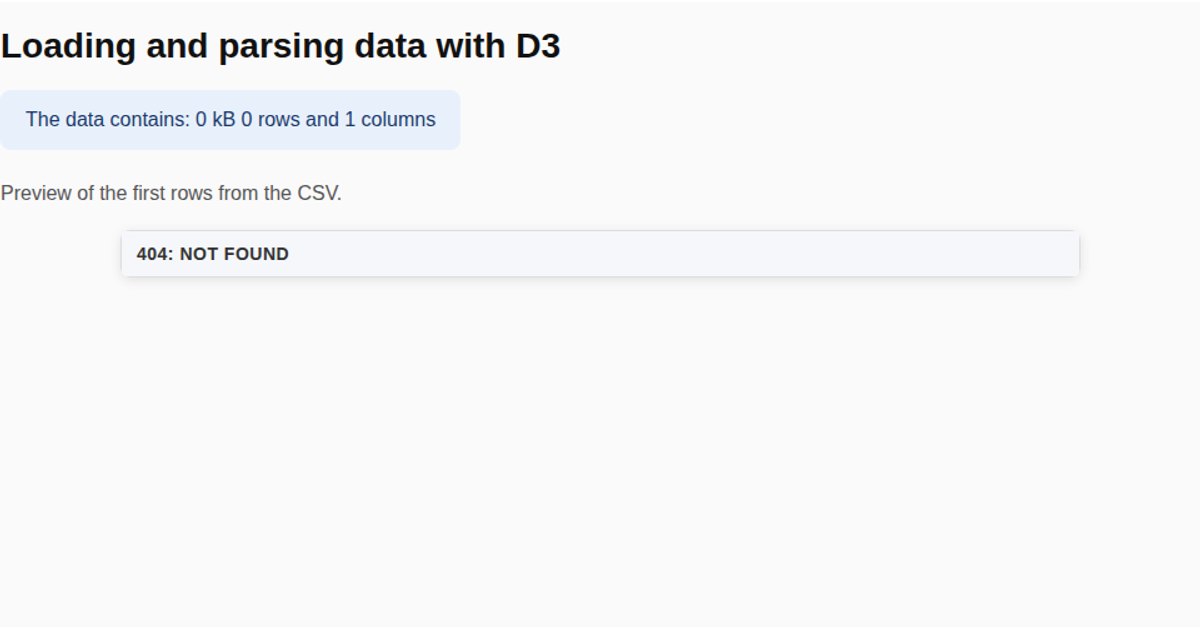
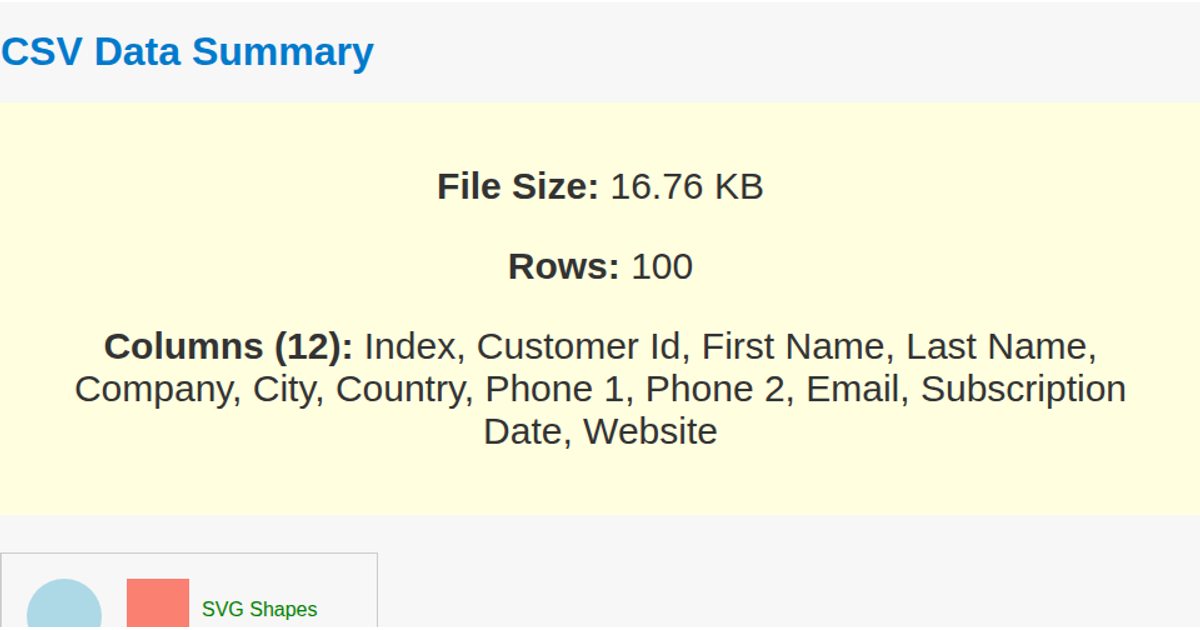
This example demonstrates loading and parsing a remote CSV dataset, displaying the file size, row count, and column count in a styled message container. The page fetches the traffic accident prediction CSV from a GitHub gist using the Fetch API, then parses it with `d3.csvParse`. A static SVG with a rectangle, circle, and text label provides a simple visual backdrop while the data summary updates dynamically in the DOM.
AI-generated descriptionMIT Licensed



Comments
Sign in to join the discussion.