🌍 Public
Fork ICE PART 1
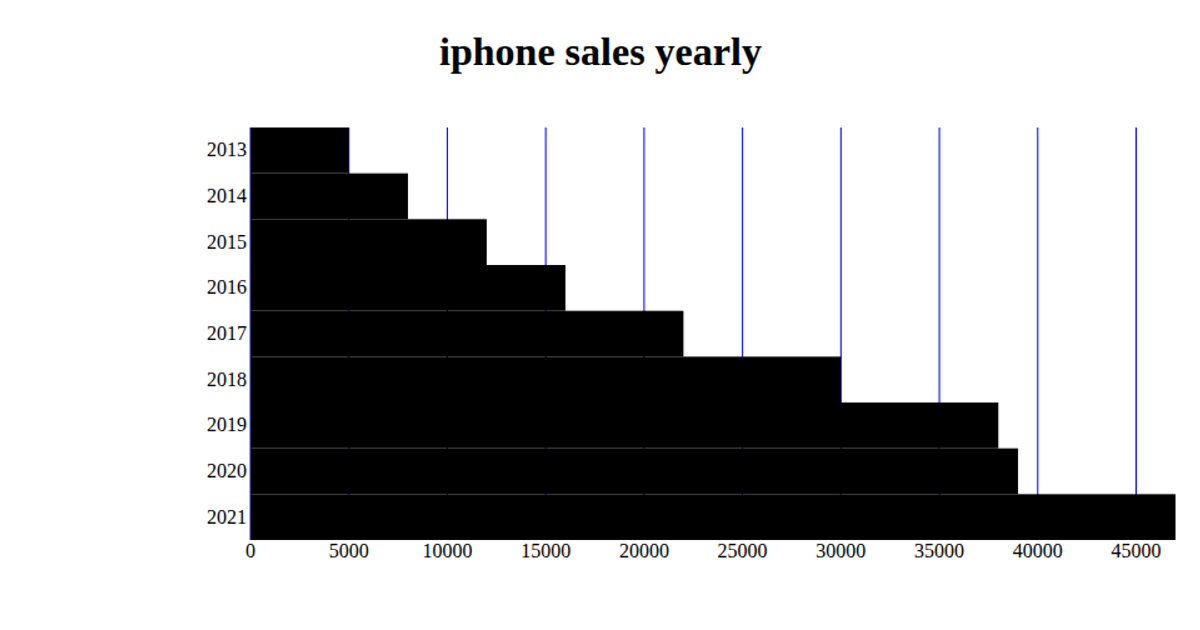
This example visualizes average smartphone sales by brand using a bar chart, with brands like Apple, Samsung, and Xiaomi sorted descending by their mean units sold. It loads a CSV dataset via PapaParse, aggregates the raw records by brand, and computes each brand’s average sales value. The chart is rendered on a Canvas element using Chart.js, with horizontal labels and a zero-based y-axis for the sales metric.
AI-generated descriptionMIT Licensed



Comments
Sign in to join the discussion.