🌍 Public
custom axis
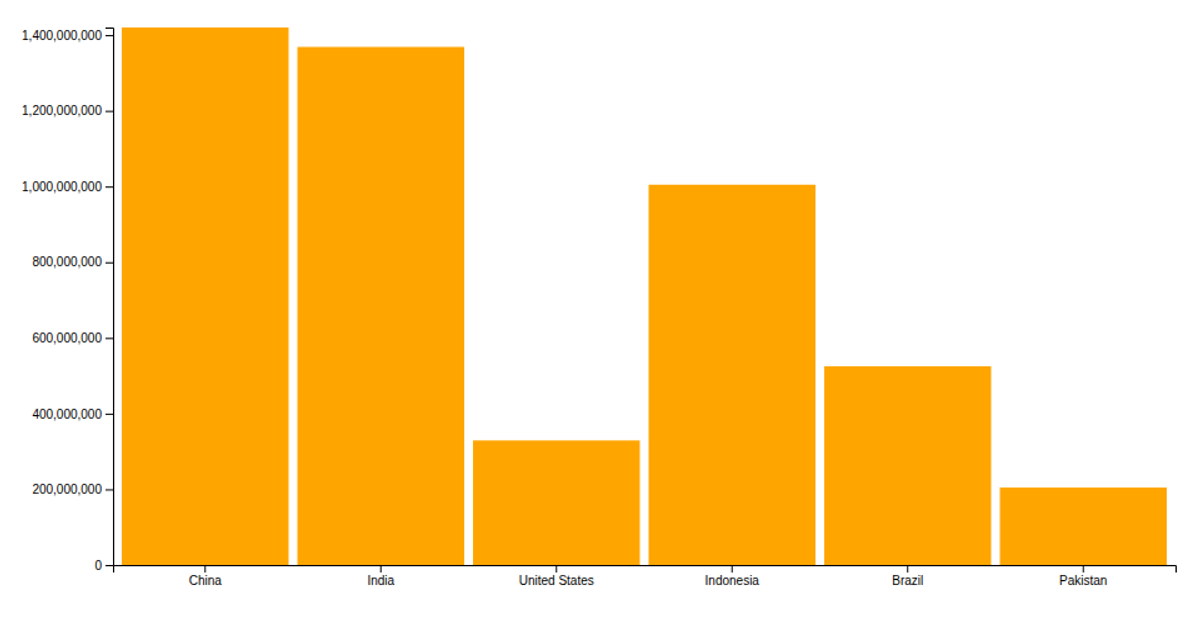
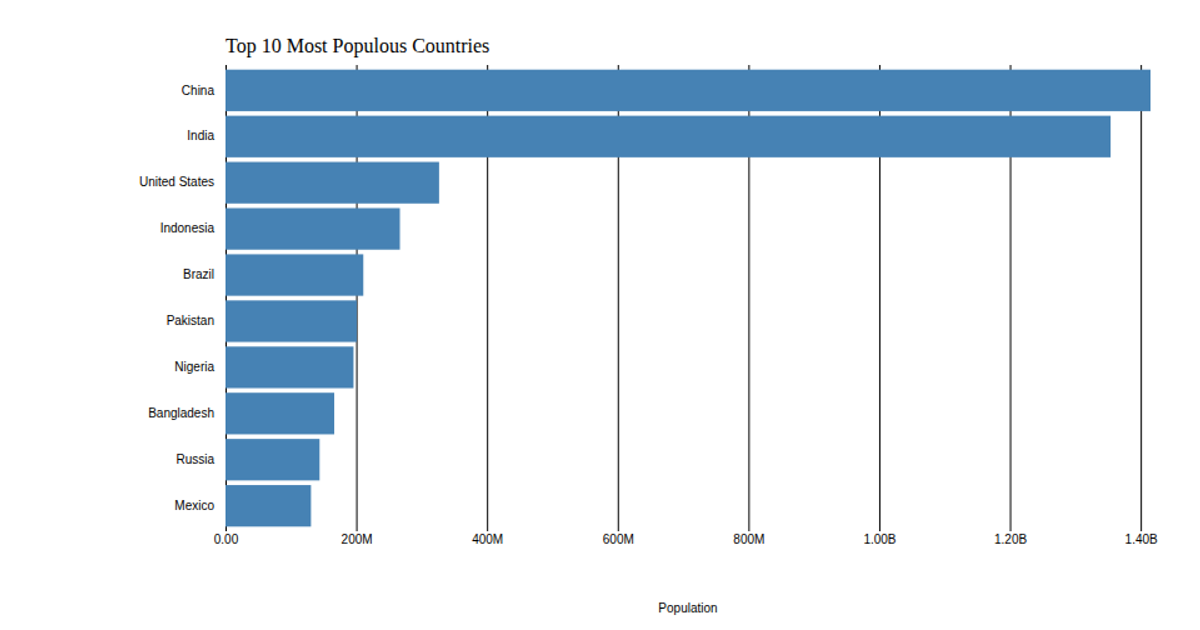
This example shows the populations of six countries as orange bars on an SVG chart, with a rotated and custom-formatted y-axis that abbreviates large numbers (e.g., "G" becomes "B" for billions). It uses D3 v5 APIs including `csv`, `scaleBand`, `scaleLinear`, `axisBottom`, and `axisLeft`, and removes default tick lines and domains for a cleaner look. The data comes from `data.csv`, with a title and axis label added via SVG text elements.
AI-generated descriptionMIT Licensed




Comments
Sign in to join the discussion.