🌍 Public
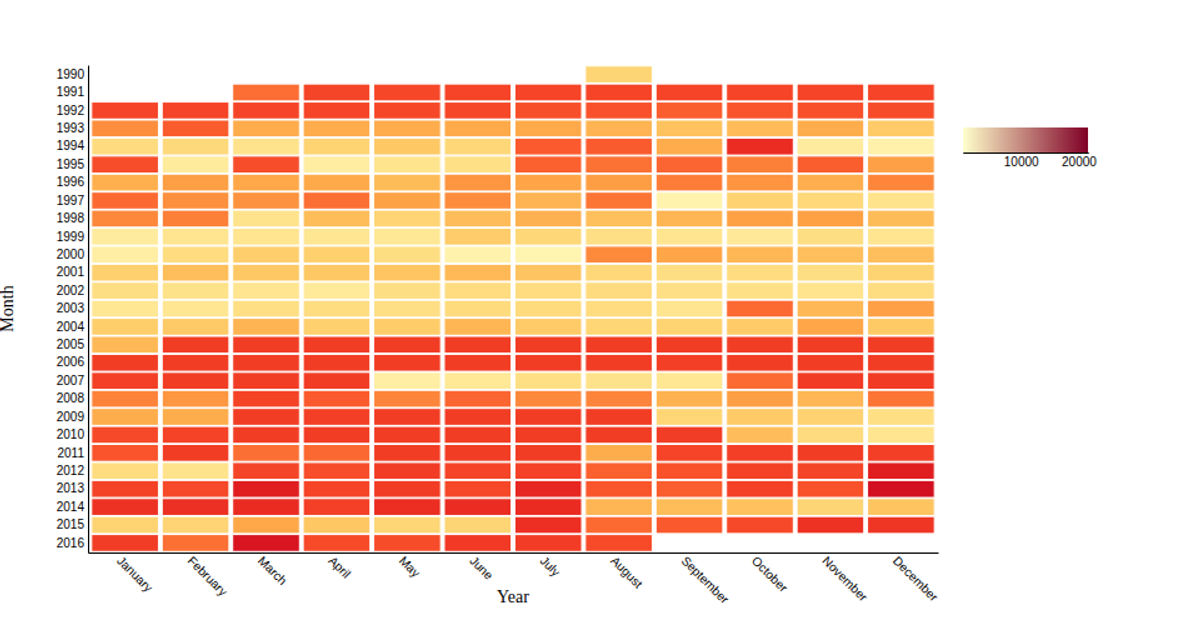
Average Broadway Theater Attendance by Month
This visualization uses a color-coded heatmap to show average monthly attendance for seven of Broadway’s most-attended theaters from 1990 to 2016. The data is loaded from a CSV file and processed in p5.js. Each theater has a row of twelve squares, colored from blue (lower attendance) to green (higher attendance), with a numeric legend and month labels. The sketch calculates per-theater monthly averages from the dataset, then scales colors between the global minimum and maximum attendance values.
AI-generated descriptionMIT Licensed



Comments
Sign in to join the discussion.