🌍 Public
Fork of ICE-7(Area)
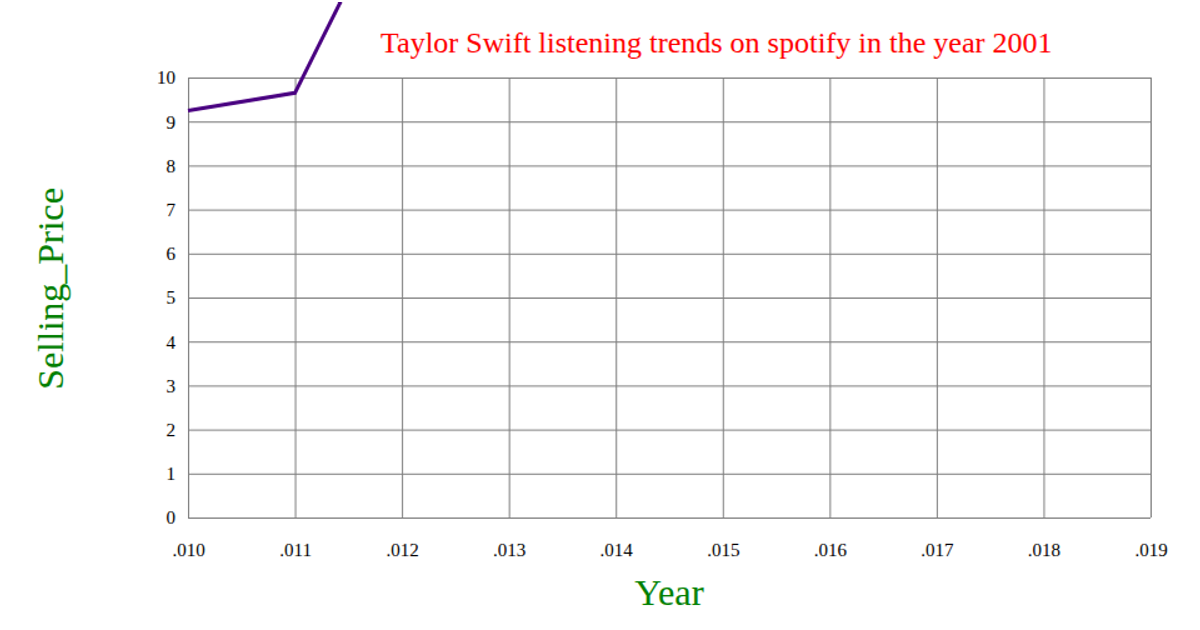
This visualization displays Taylor Swift listening trends on Spotify for 2001, using a pink area chart where the x-axis maps months and the y-axis quantifies listening hours. The code leverages D3 v5 functions including `scaleTime`, `scaleLinear`, `area`, `curveBasis`, `axisBottom`, and `axisLeft` to construct the chart. It loads its data from a GitHub-hosted CSV file. SVG rendering is used, with styling for axes, labels, and title applied through CSS classes.
AI-generated descriptionA bare minimum HTML page demonstrating use of CSS and JavaScript.
See also React Starter.
MIT Licensed




Comments
Sign in to join the discussion.