🌍 Public
Task 9 & 10 D3 Q1 Pie chart UN
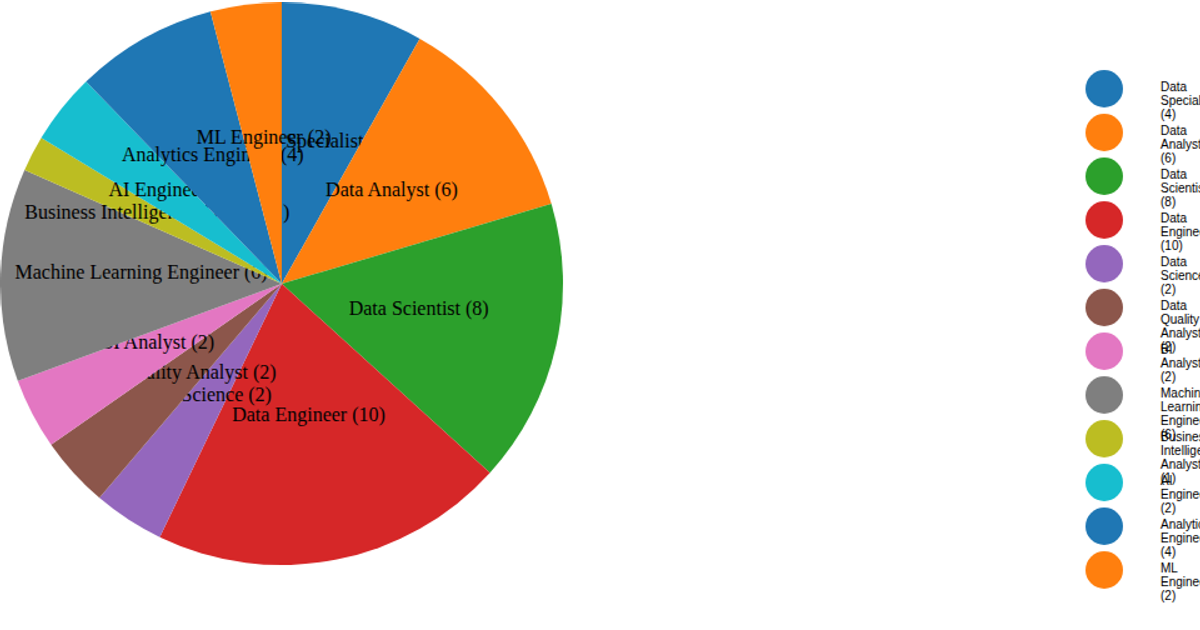
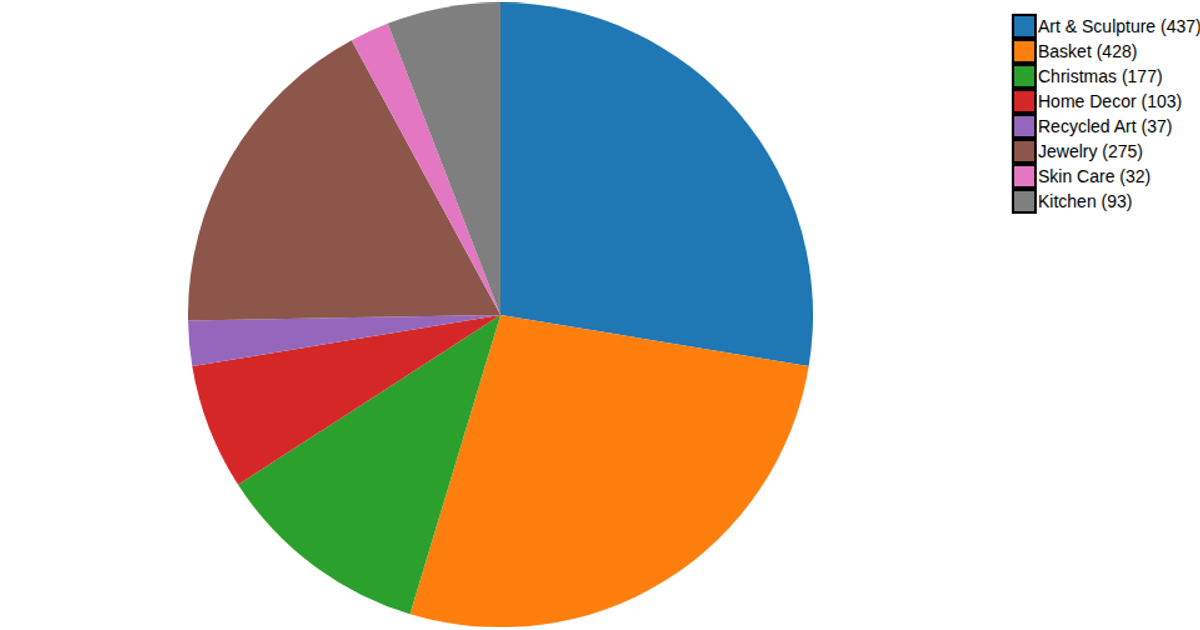
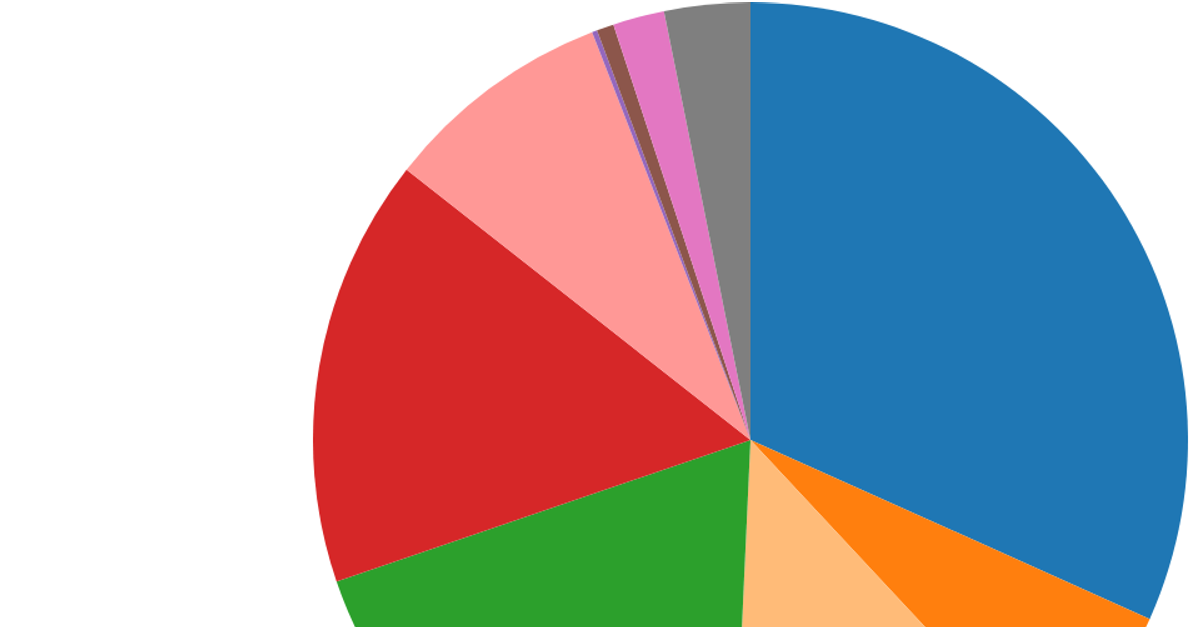
A D3 pie chart visualizes the top 10 companies by revenue, with each slice labeled in billions and a matching color-coded legend. The chart uses `d3.pie()` and `d3.arc()` to generate segments, `d3.scaleOrdinal` for colors, and SVG text elements for labels. Revenue data is loaded from a CSV file, formatted with `d3.format`, and rendered at 500 pixels high with a legend positioned to the side.
AI-generated descriptionMIT Licensed




Comments
Sign in to join the discussion.