🌍 Public
Practice Graph
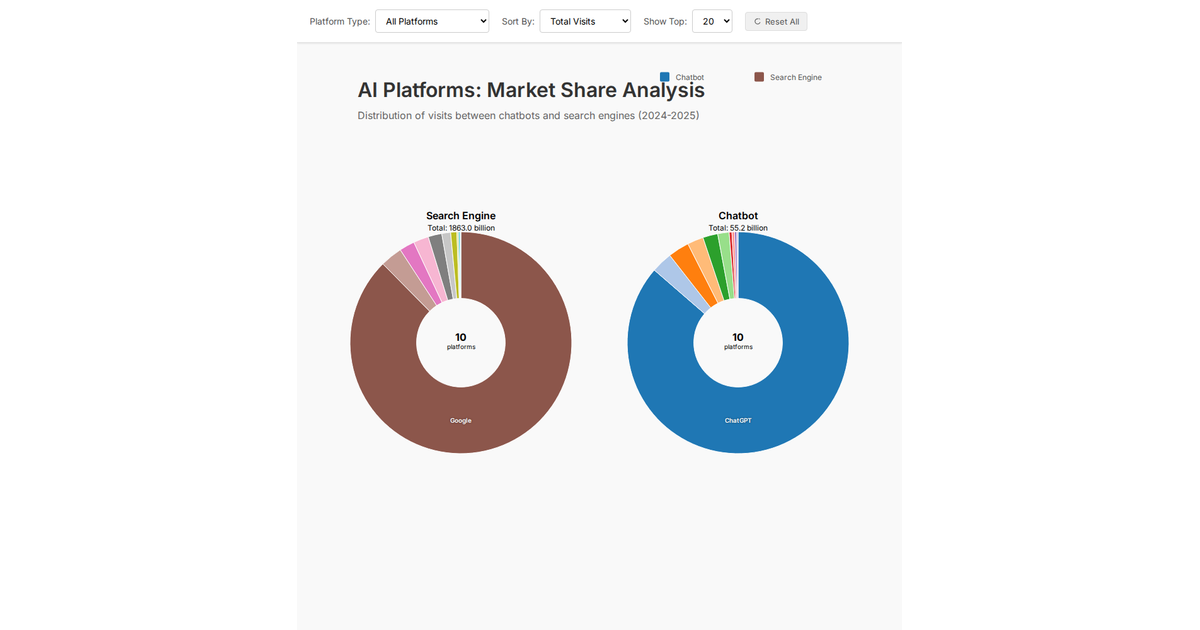
This interactive donut chart visualizes the relative volume of stock ticker mentions (e.g., GME, AMC) in social media posts. The largest segment is highlighted by default, and hovering or focusing on any segment triggers an animation that expands that arc and reveals its label. Built with D3 v4 within a React framework, the visualization uses `d3.pie`, custom `d3.arc` paths, and CSS transitions for the hover effects, rendering segments as SVG paths with distinct colors.
AI-generated descriptionA bare minimum HTML page demonstrating use of CSS and JavaScript.
See also React Starter.
MIT Licensed




Comments
Sign in to join the discussion.