🌍 Public
World map
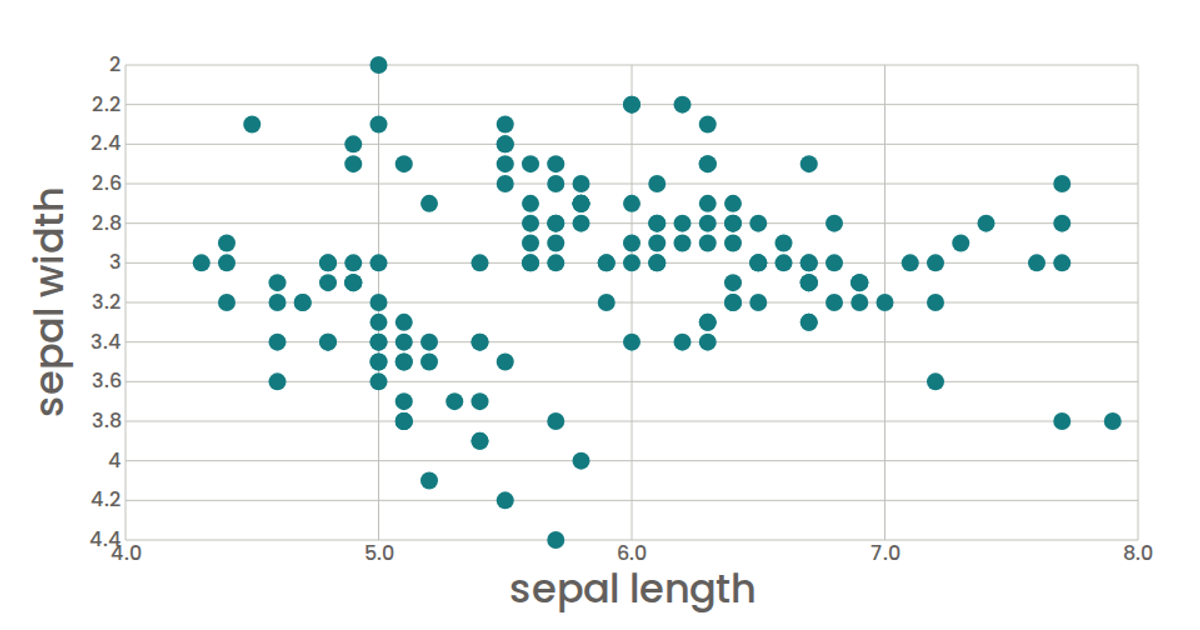
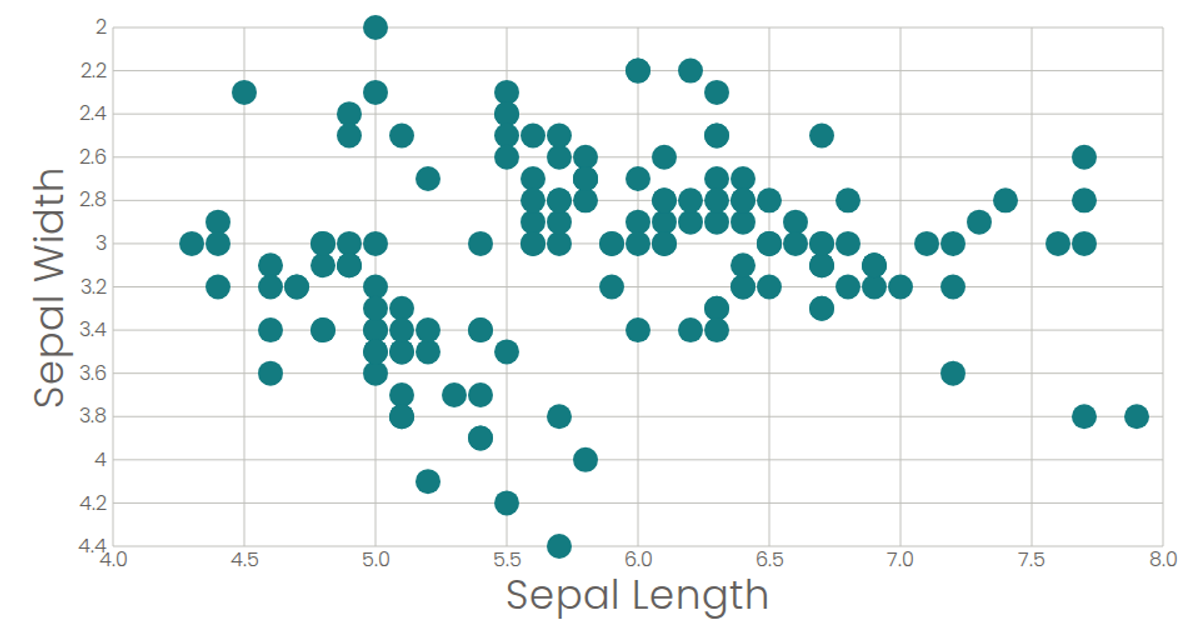
This visualization displays the classic Iris flower dataset as a scatterplot, mapping sepal length on the x-axis against sepal width on the y-axis. Each black circle represents a single flower sample, with the plot rendered within a framed chart area using margins. Built with React and D3 v7, the code uses `d3.scaleLinear` for both axes, `d3.extent` to compute the domain from the CSV data, and `d3.axisBottom`/`d3.axisLeft` for ticks. Axis labels are added with custom text elements, and the visualization updates dynamically as the data loads.
AI-generated descriptionMIT Licensed




Comments
Sign in to join the discussion.