🌍 Public
Fork of Data Visualization- Scatter Plot with Iris DataSet
RRamakanth771
Last edited Mar 7, 2022
Created on Mar 7, 2022
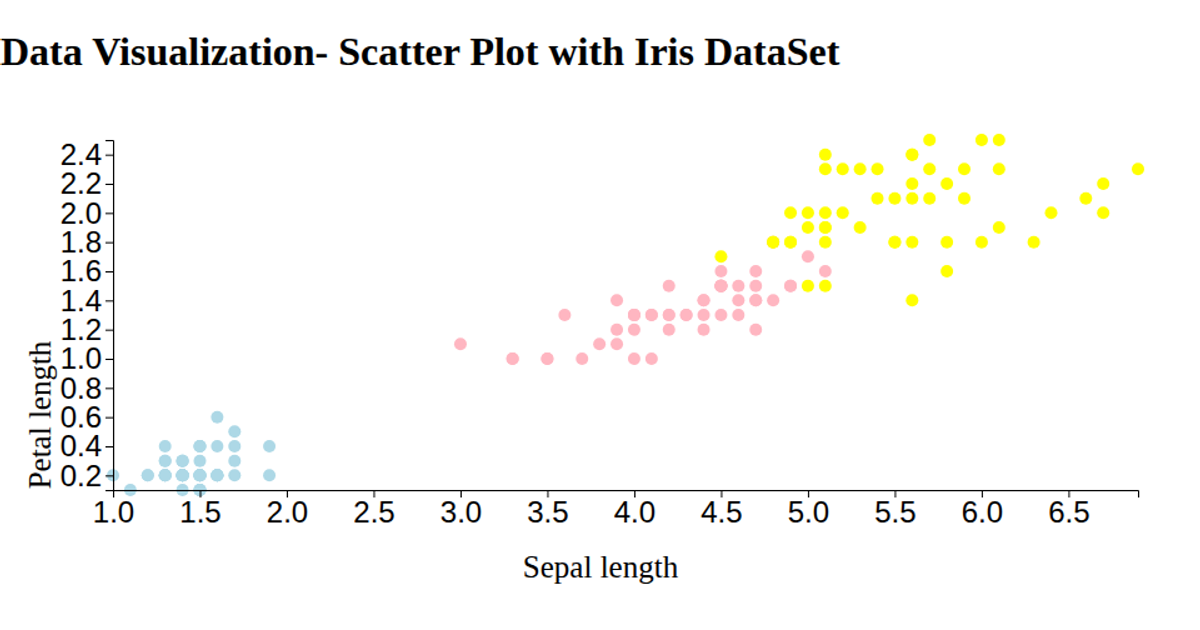
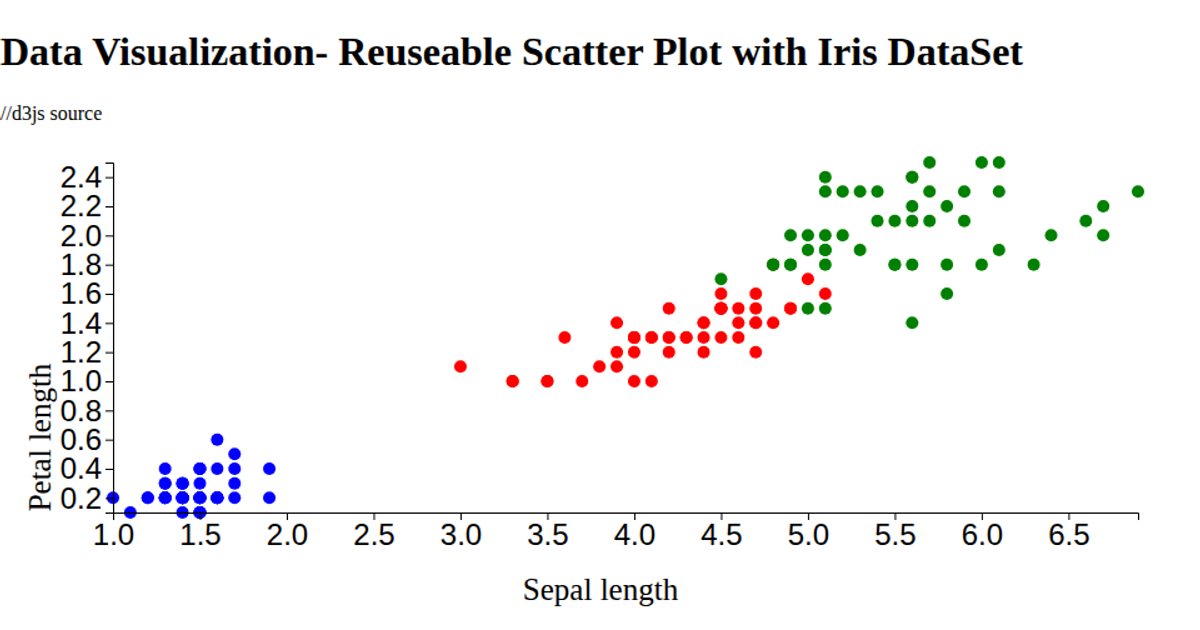
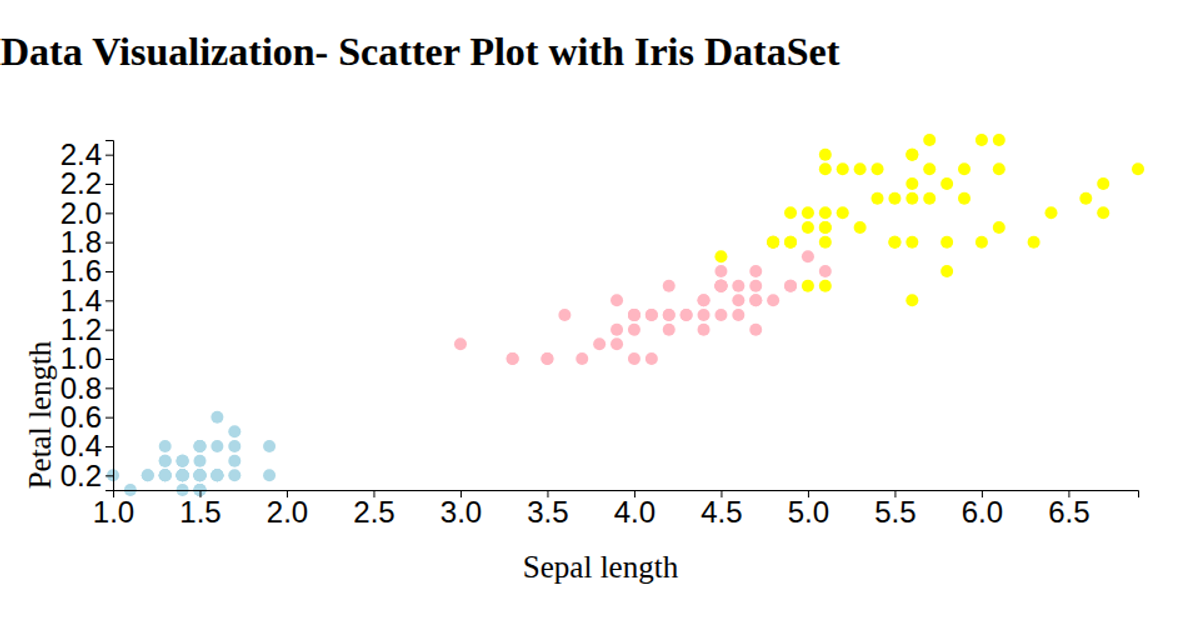
This interactive scatter plot visualizes the Iris dataset, mapping petal length and width on the x and y axes, with each point colored by species (setosa, versicolor, or virginica). The visualization is built with React and D3 v6, using `d3.csv` to load data, `scaleLinear` for axis scaling, and `axisLeft`/`axisBottom` for rendering the chart axes. Points are drawn as SVG circles with a fixed radius, while the axis labels are added as text elements. The plot does not use any interactivity beyond the rendering itself.
AI-generated descriptionA bare minimum HTML page demonstrating use of CSS and JavaScript.
See also React Starter.
MIT Licensed




Comments
Sign in to join the discussion.