🌍 Public
Bar Chart
KKathi7-dot
Last edited Mar 3, 2022
Created on Mar 3, 2022
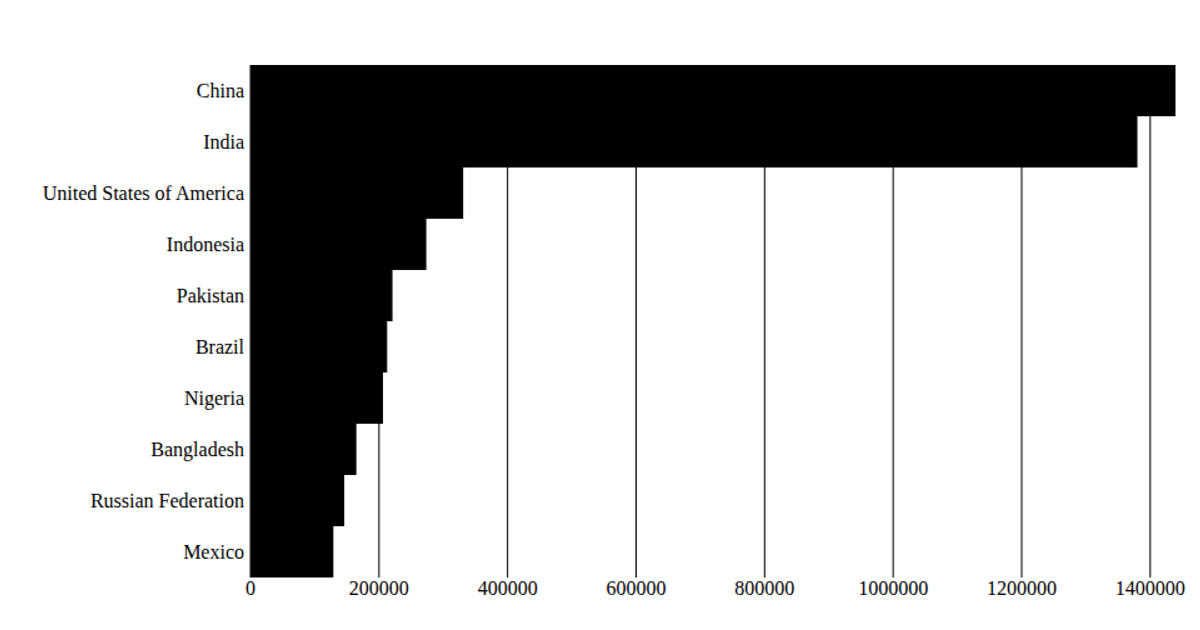
This bar chart visualizes texting frequency by location, sourced from a CSV file accessed via a URL. The React app uses D3 v5 utilities like `scaleBand`, `scaleLinear`, `max`, and `csv` to process the data, which is sorted to show the top ten locations. Rendered as an SVG, the chart displays horizontal bars with a blue x-axis gridline, where each bar’s length corresponds to the numeric count from the '2019' column. The D3 `axis` functions are not directly used, but the scales and data mapping drive the visual encoding.
AI-generated descriptionA bare minimum HTML page demonstrating use of CSS and JavaScript.
See also React Starter.
MIT Licensed




Comments
Sign in to join the discussion.