🌍 Public
Air Quality Dataset - Vignesh
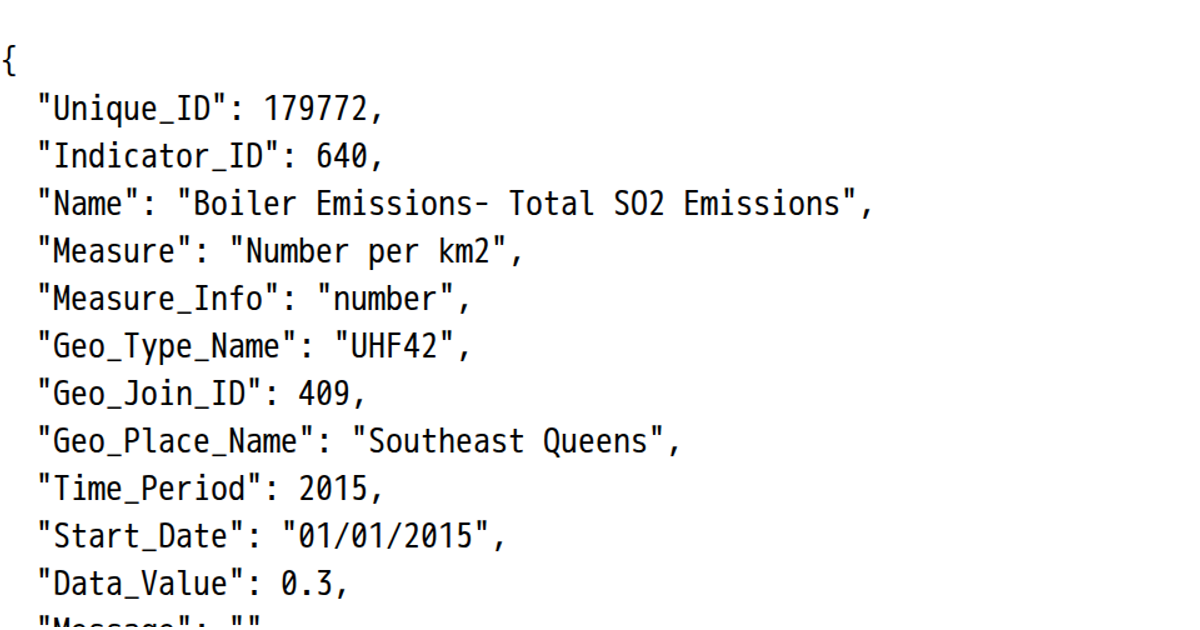
This example displays the first record from the New York City Air Quality dataset, which tracks nitrogen dioxide (NO2) levels by neighborhood and time period. The code loads the CSV file with a raw import, converts numeric fields, and renders the parsed JSON object in a `<pre>` element with a 24px font size. It demonstrates basic data loading and inspection using standard JavaScript array methods, with no external visualization libraries involved. The displayed record includes fields like Geo_Place_Name, Time_Period, and Data_Value, showing the dataset’s structure for annual averages and seasonal measurements.
AI-generated descriptionData Source: https://catalog.data.gov/dataset/air-quality
MIT Licensed


Comments
Sign in to join the discussion.