🌍 Public
Activity6_task3.1
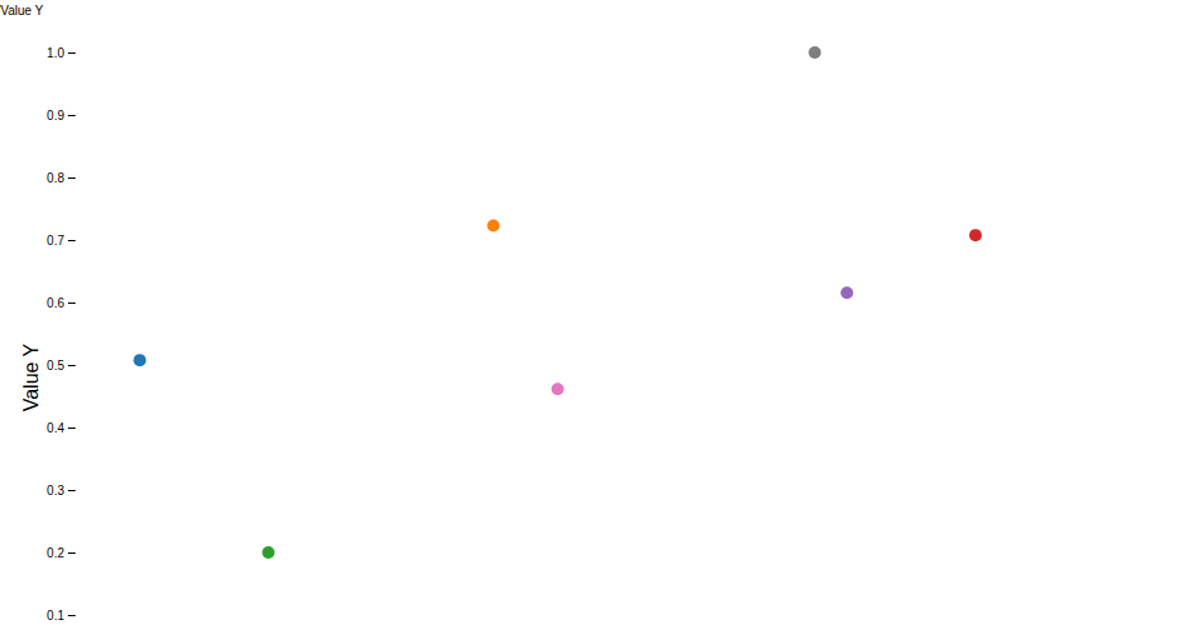
This scatter plot visualizes country data with D3.js v7, mapping two quantitative variables to the x- and y-axes and encoding a third dimension through point color. The rendering uses D3's SVG circle elements within a Cartesian coordinate system, with axes and tick labels styled via CSS. Hovering over a point triggers a D3 mouseover event that displays a tooltip showing the country's precise values.
AI-generated descriptionMIT Licensed




Comments
Sign in to join the discussion.