🌍 Public
Pie Chart_Archana Goli
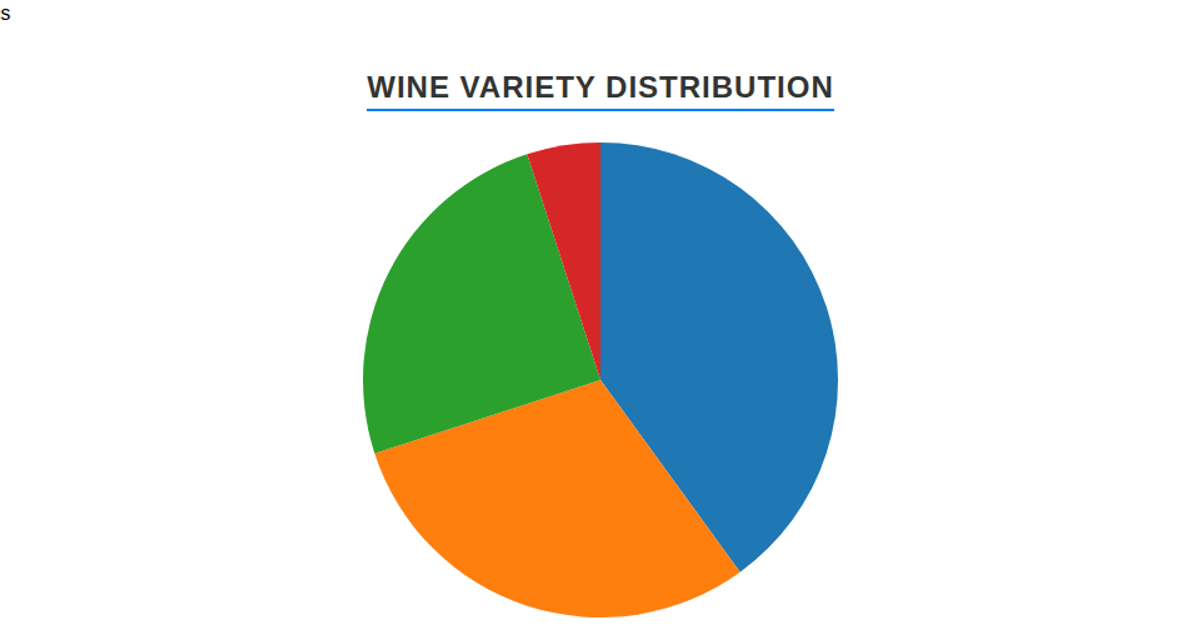
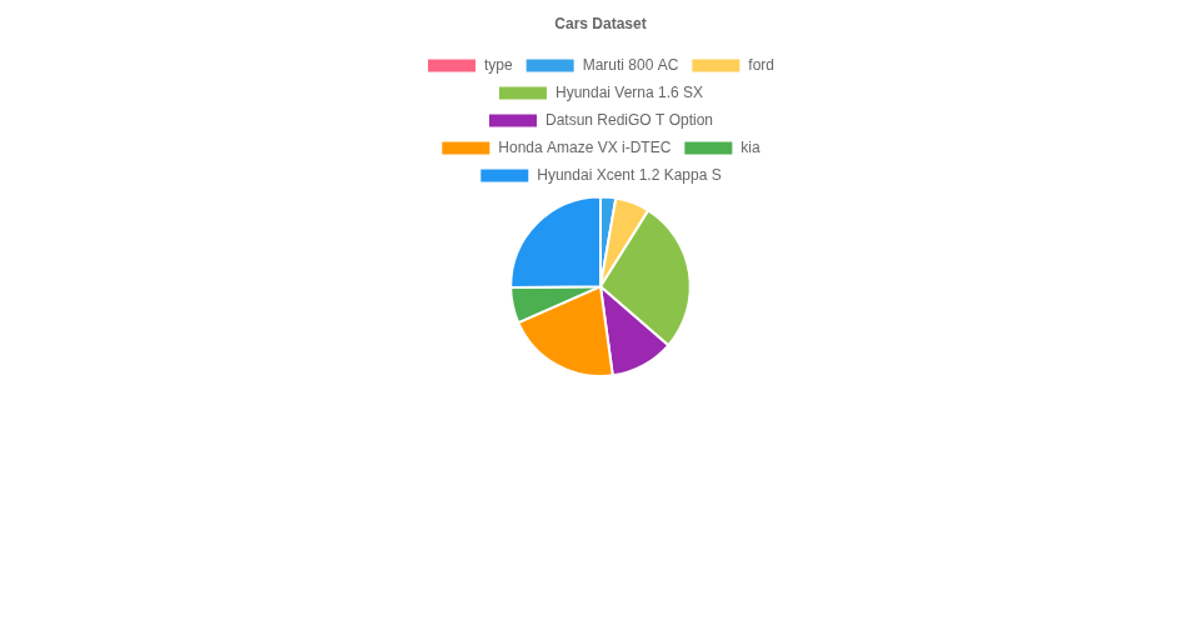
This pie chart shows the distribution of kernel types (Kama, Rosa, and Canadian) in a dataset, with each slice’s percentage displayed in a custom legend below the canvas. The chart is rendered using the Chart.js library on a fixed-size canvas element, which reads data from a remote text file via the Fetch API. It counts occurrences of each kernel type from the CSV rows, then draws the pie with semi-transparent colors and a disabled default legend in favor of a dynamically generated HTML legend.
AI-generated descriptionA bare minimum HTML page demonstrating use of CSS and JavaScript.
See also React Starter.
MIT Licensed





Comments
Sign in to join the discussion.