🌍 Public
ICE - 8 Social Network
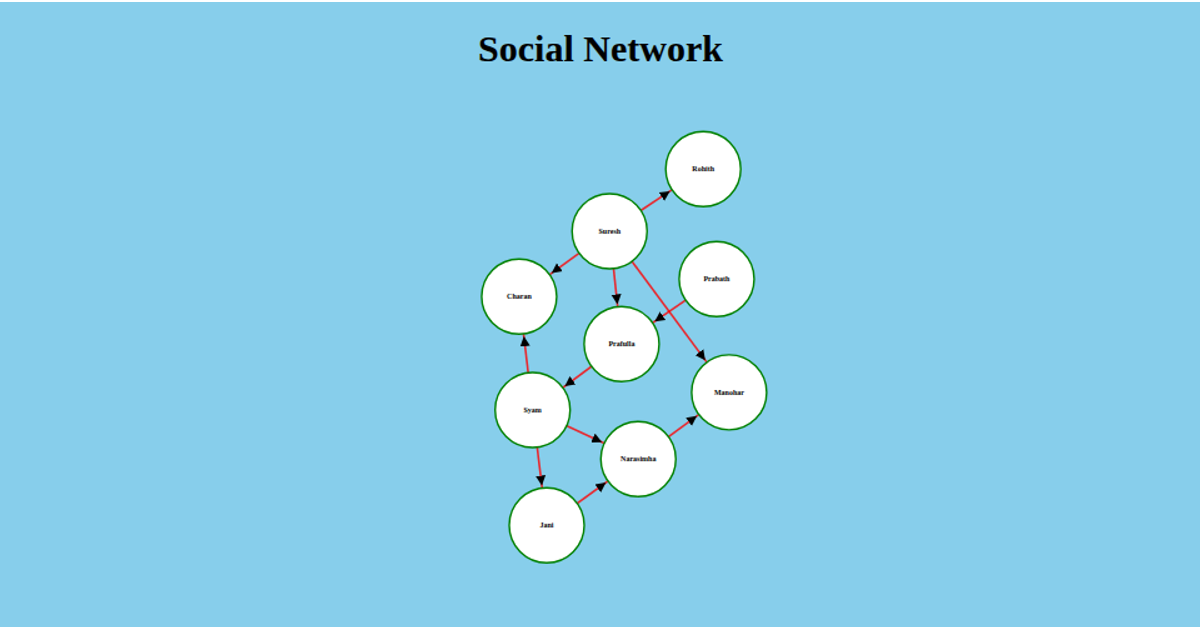
This example shows a force-directed social network graph of people and films, with colored nodes representing different groups and links labeled by relationship types such as "Acted in" and "Directed." The visualization uses `d3.forceSimulation` with `forceLink`, `forceManyBody`, and `forceCollide` to position nodes, while nodes are rendered as SVG circles with text labels. Drag interactions are enabled via `d3.drag` to reposition nodes, and hover highlighting is applied through CSS classes. The data comes from a local JSON file with explicit source and target node references.
AI-generated descriptionForce Network chart using D3 v6
MIT Licensed



Comments
Sign in to join the discussion.