🌍 Public
Making a Bar Chart
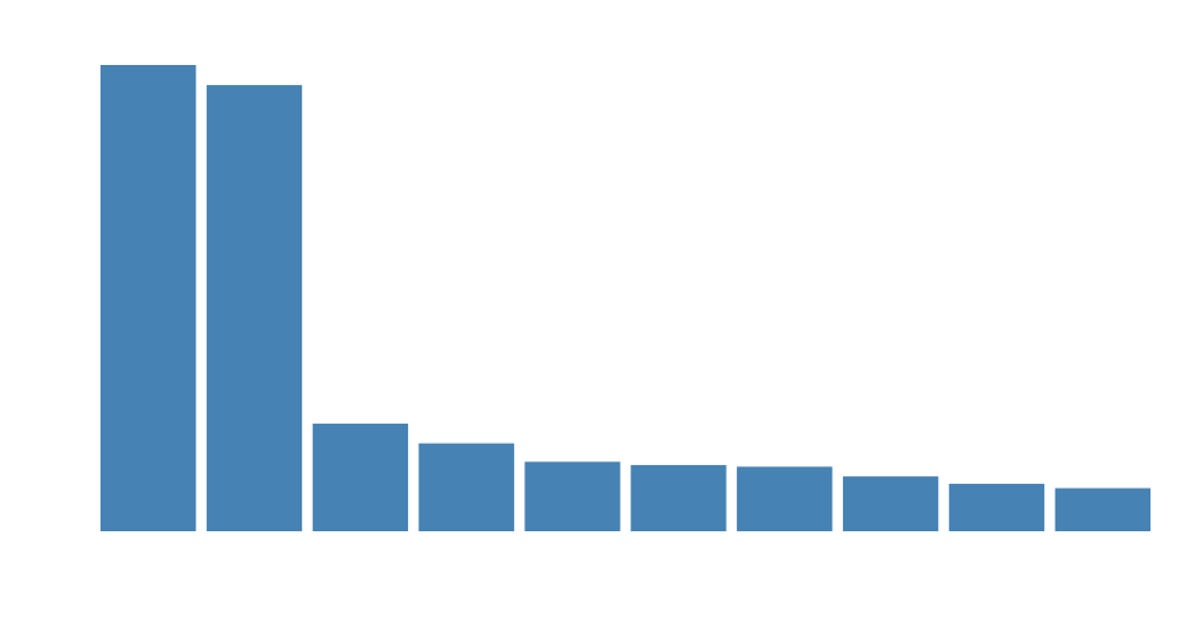
This example displays a horizontal bar chart comparing the 2018 populations of the top ten most populous countries, with data sourced from the United Nations’ World Population Prospects 2017. The visualization uses D3 v5’s `scaleLinear` and `scaleBand` to map population values and country names, appending SVG rectangles for each bar. It demonstrates the classic D3 workflow of loading CSV data, converting population strings to numbers, and using `axisLeft` and `axisBottom` to render the chart’s axes.
AI-generated descriptionThis bar chart shows population of the top 10 most populous countries. The data comes from the year 2018 estimate in United Nations: World Population Prospects 2017.
MIT Licensed




Comments
Sign in to join the discussion.