🌍 Public
Galère Césure with Color - React & D3
MManon ROMAIN
Last edited Oct 28, 2021
Created on Oct 28, 2021
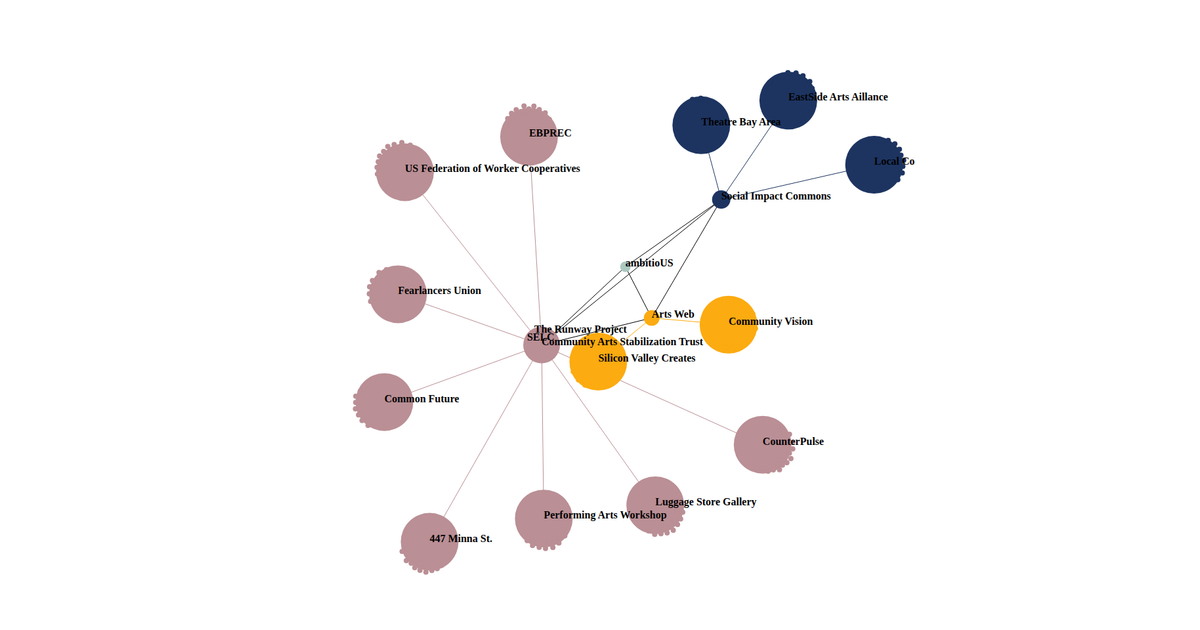
This example visualizes the email exchange network among colleagues involved in a thesis procedure, using a force-directed layout. Node position encodes sender or recipient roles, while node size reflects the total number of sent and received emails. A color legend identifies each person, and hovering dims unrelated nodes. The visualization is built with React and D3 v7, using `d3.scaleOrdinal` for color, `d3.scaleLinear` for positioning and sizing, and SVG circles for marks. Data comes from a CSV file loaded via `d3.csv`.
AI-generated descriptionMenus with React & D3
MIT Licensed




Comments
Sign in to join the discussion.