🌍 Public
Pie chart II
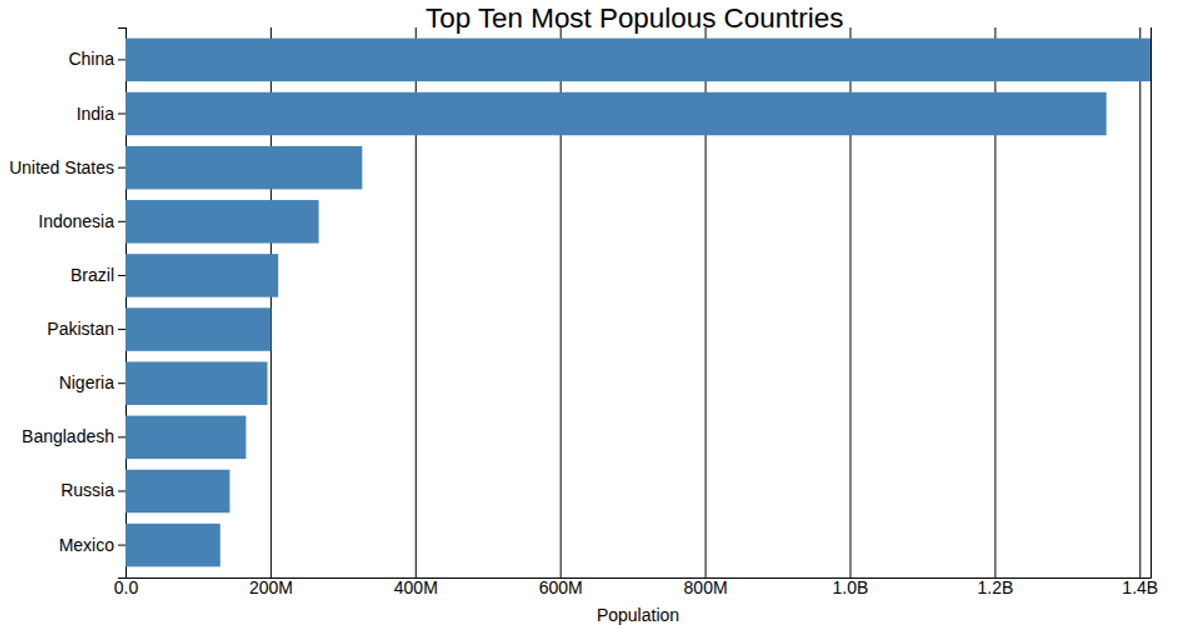
This bar chart displays the population of the top 10 most populous countries, using a horizontal bar layout where each bar’s length corresponds to population size in millions. The data is loaded from a local CSV file with `d3.csv`, and scales are created with `d3.scaleLinear` and `d3.scaleBand`. Axes are rendered using `d3.axisBottom` and `d3.axisLeft`, with tick formatting via `d3.format` to abbreviate large numbers. The chart is drawn as SVG elements, with bars styled through CSS and a title added as text.
AI-generated descriptionThis bar chart shows population ... (https://www.un.org/en/) O formátech (http://bl.ocks.org/zanarmstrong/05c1e95bf7aa16c4768e) O barvách (Google: data visualization style guide sunlight)
MIT Licensed




Comments
Sign in to join the discussion.