🌍 Public
HTML Starter_mohammed
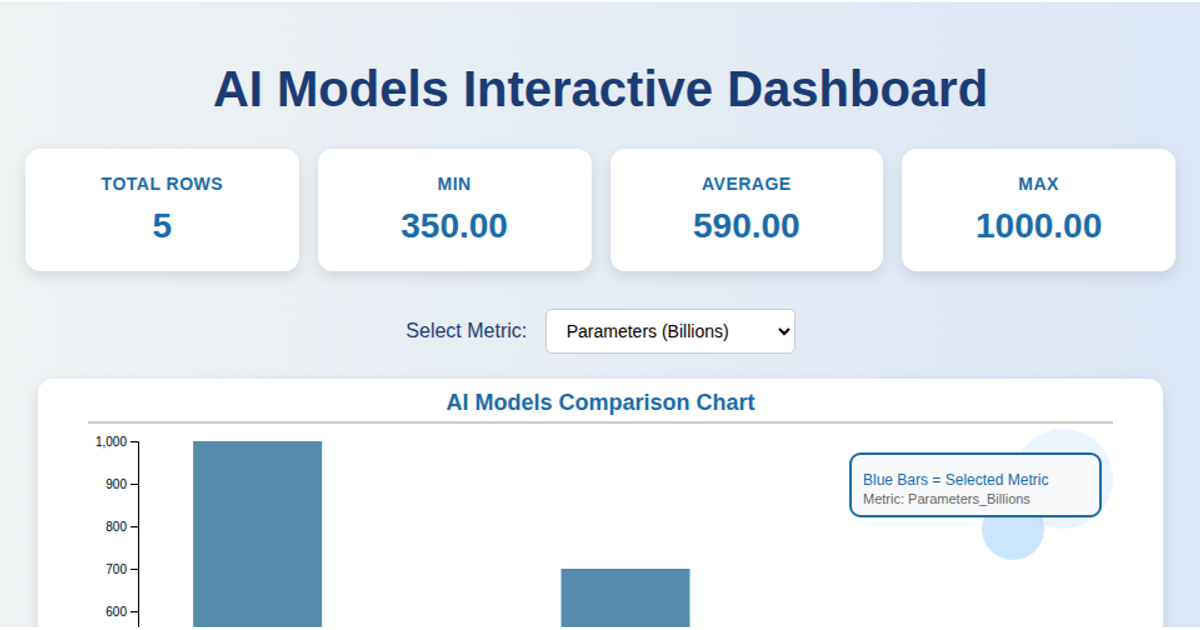
This example presents a dataset summary dashboard for DFW public library weekly visits in 2025, showing five key metrics in a dark-themed card layout. The visualization uses D3 v7 to load CSV data via `d3.csv`, calculates aggregate statistics with `d3.mean` and `d3.max`, and renders metric cards using `d3.select` with a data join. The SVG badge and styled metric cards are built with HTML and CSS, while the data-driven values update dynamically through D3's data binding.
AI-generated descriptionMIT Licensed





Comments
Sign in to join the discussion.