🌍 Public
Activity-8_Task-4
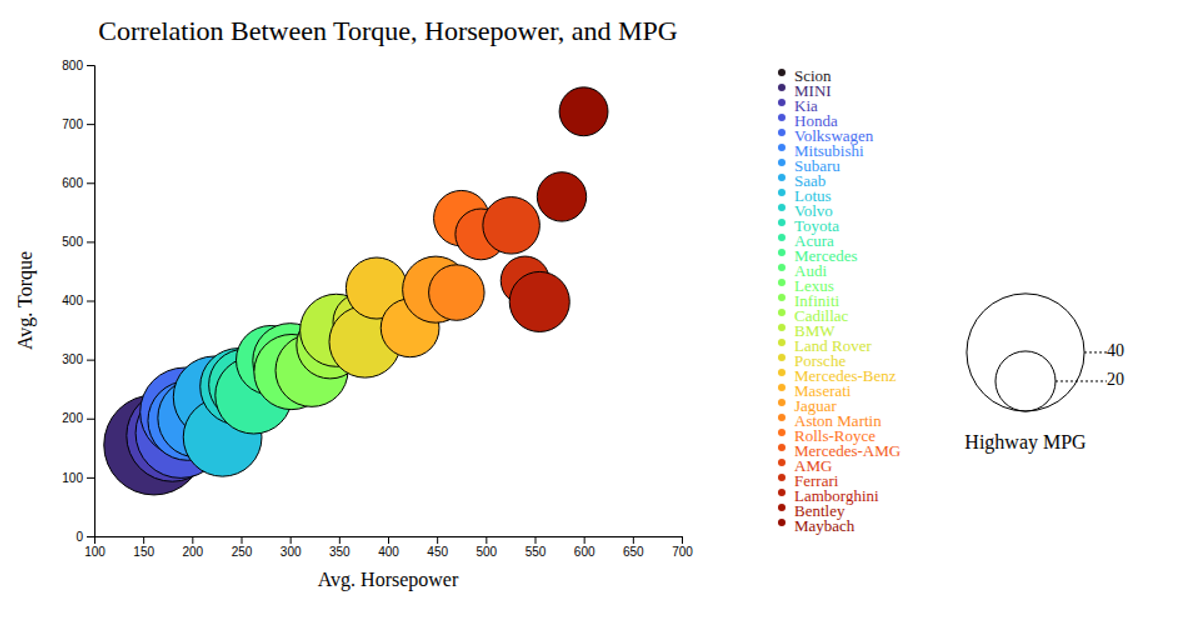
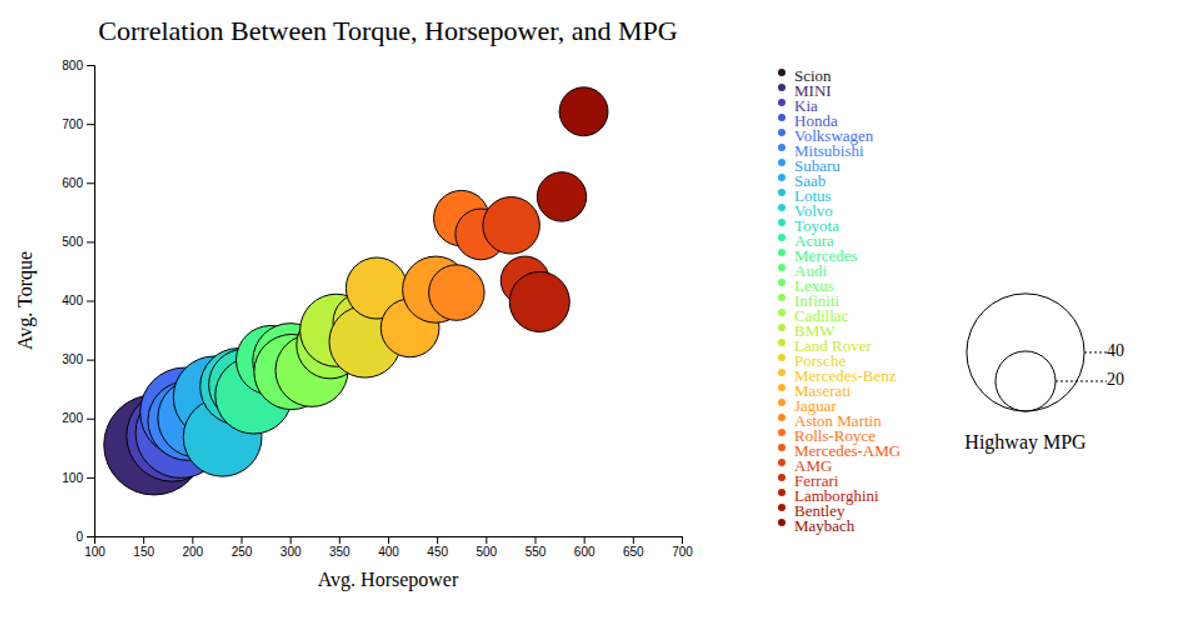
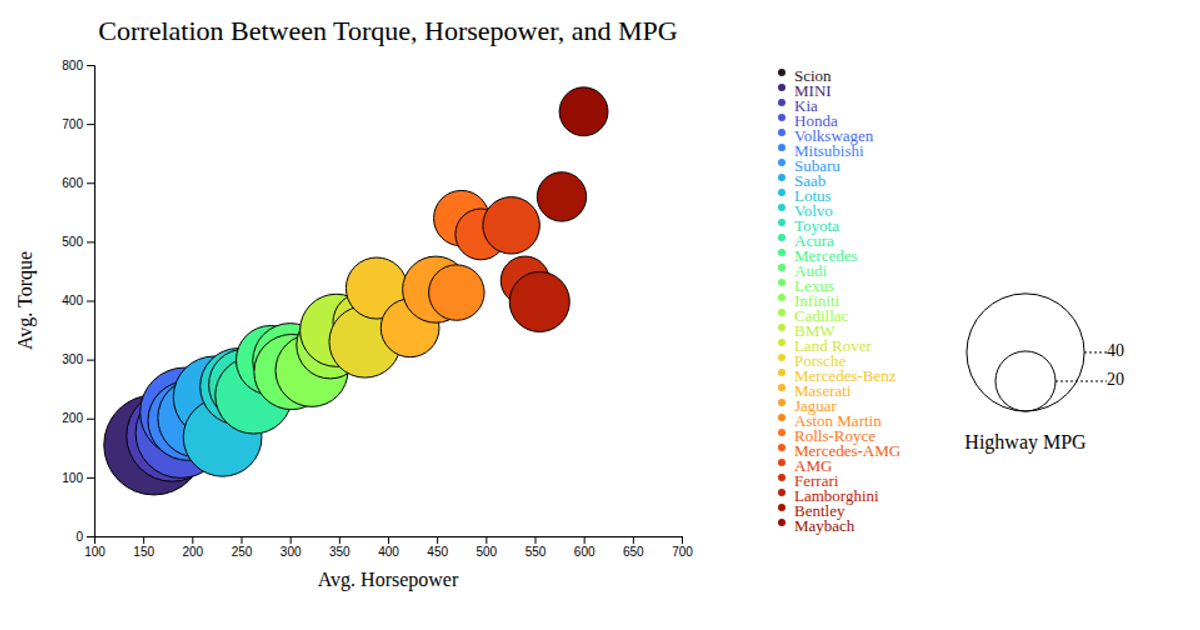
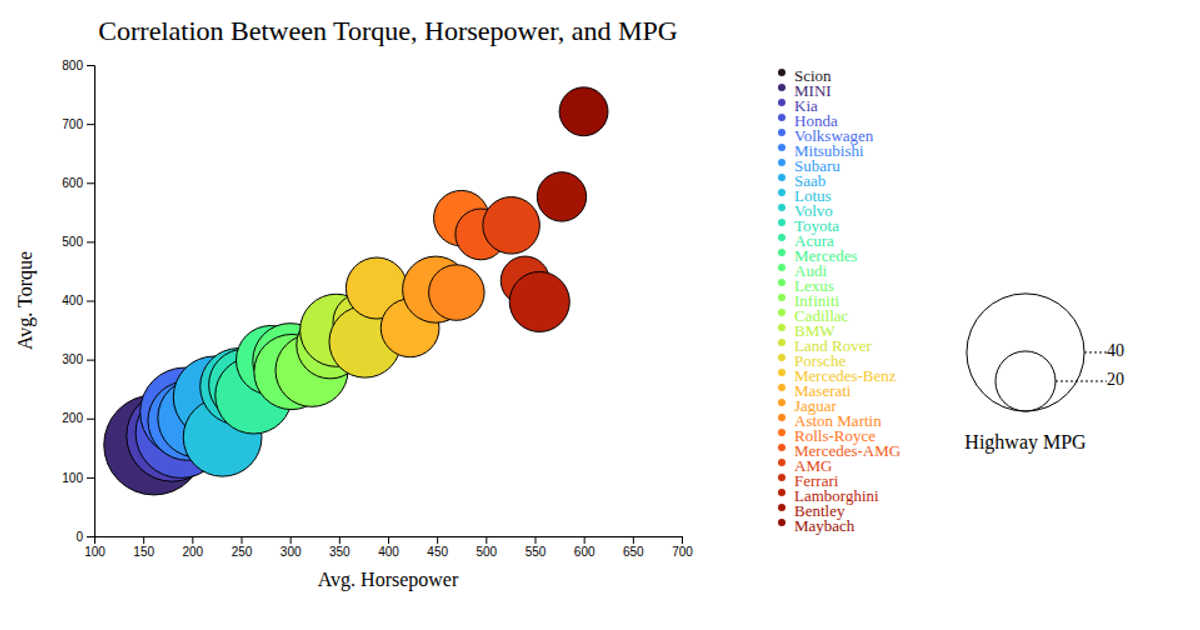
This example presents a bubble chart exploring the relationship between average horsepower, torque, and highway MPG for different car makes. The visualization encodes horsepower on the x-axis, torque on the y-axis, and uses bubble size to represent highway MPG via a linear scale, while color distinguishes each car make using an ordinal scale with the interpolateTurbo palette. The chart is rendered with SVG in D3 v7, and includes interactive tooltips that appear on mouseover to display each make’s name. A legend at the right explains both the bubble size mapping and the color assignments per make.
AI-generated descriptionAn example showing the capabilities of VizHub:
- Loads D3 via UNPKG.
- Demonstrates use of
importfrom"d3". - Demonstrates use of
importfrom local ES6 modules.
MIT Licensed




Comments
Sign in to join the discussion.