🌍 Public
Curranians on VizHub Planet
FFelipe Maion
Last edited May 9, 2021
Created on May 9, 2021
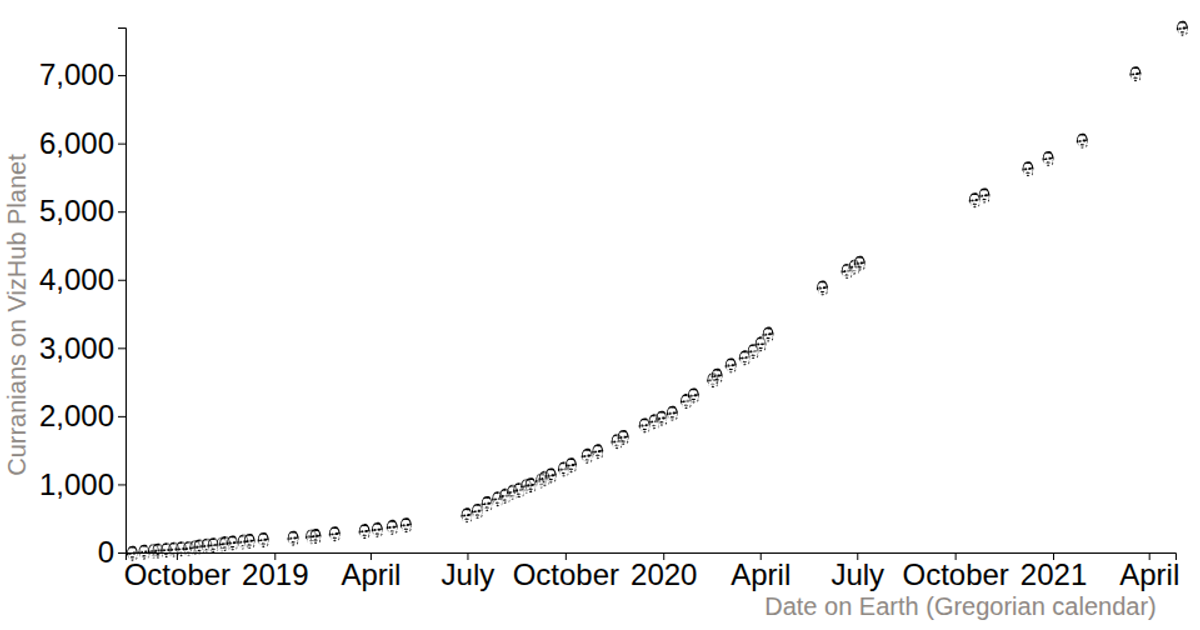
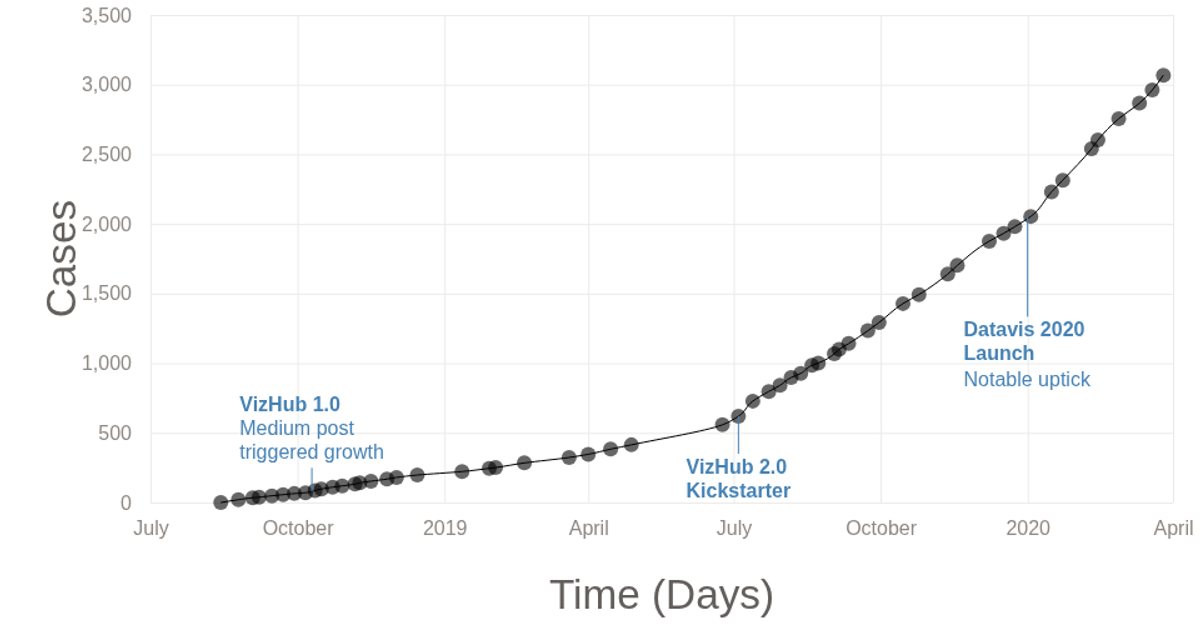
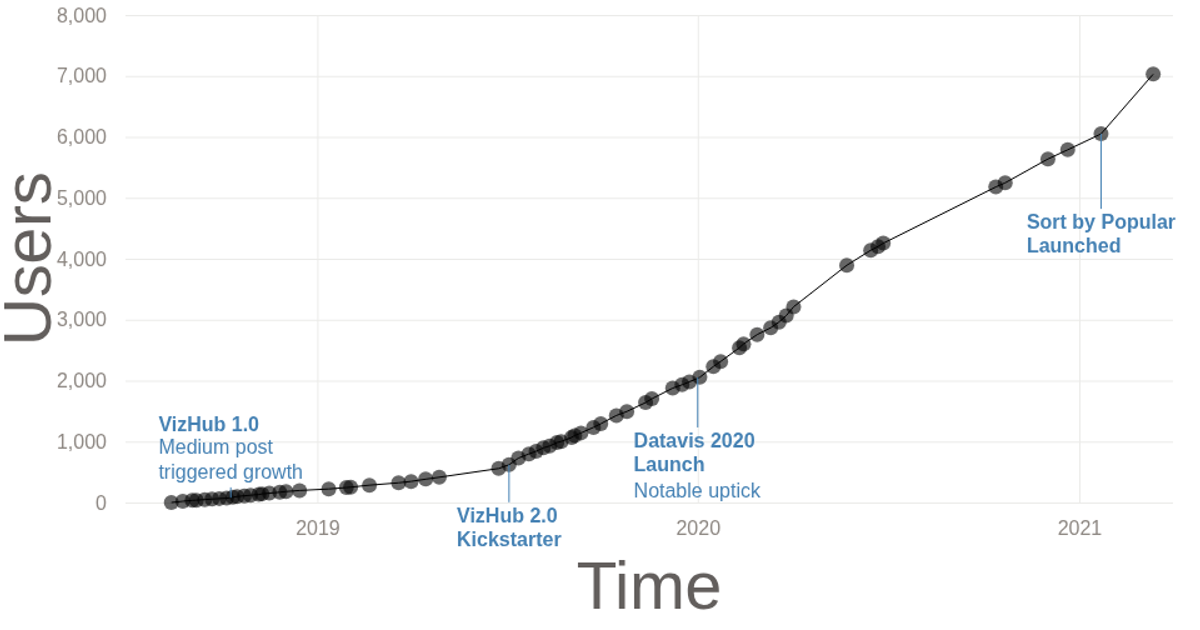
This scatter plot visualizes the growth of registered users on VizHub over time, from August 2018 to April 2021. Each data point is rendered as a small custom SVG path of a face, scaled and positioned using D3’s `scaleTime` and `scaleLinear`. The code uses `d3.csv` to load the data, `axisLeft` and `axisBottom` for the axes, and `selection.append('path')` with a pre-defined path string from a separate `paths.js` module.
AI-generated descriptionA (curranianPlot) scatterPlot showing how many (curranians) users are current on the (planet) site VizHub
MIT Licensed



Comments
Sign in to join the discussion.