🌍 Public
Task-8-Q4.9
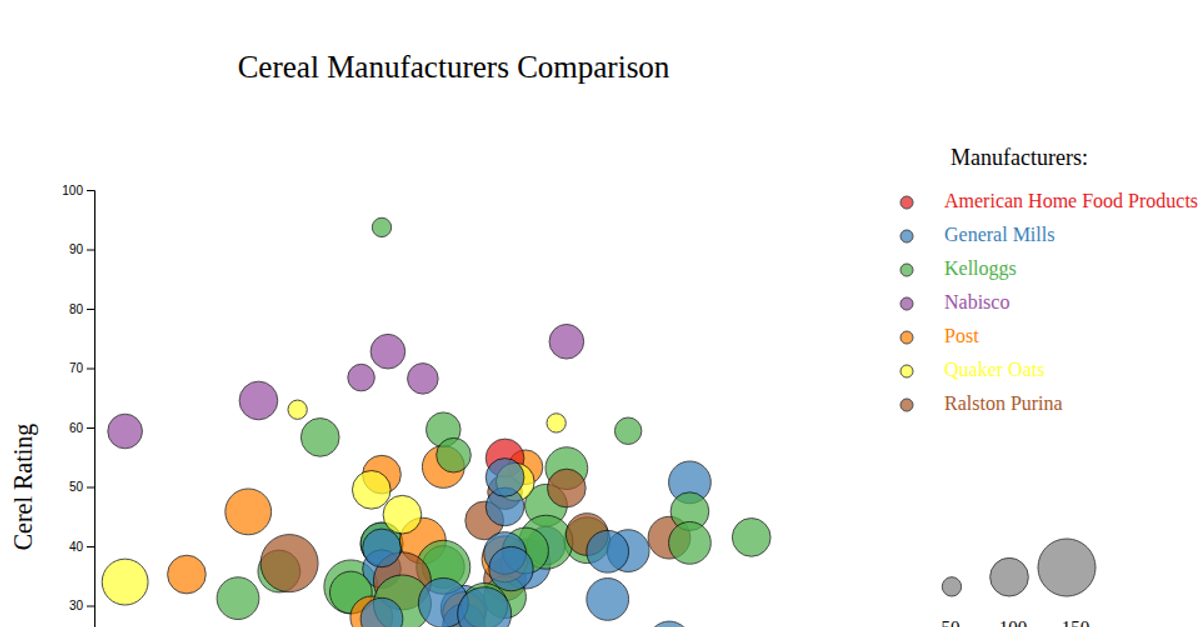
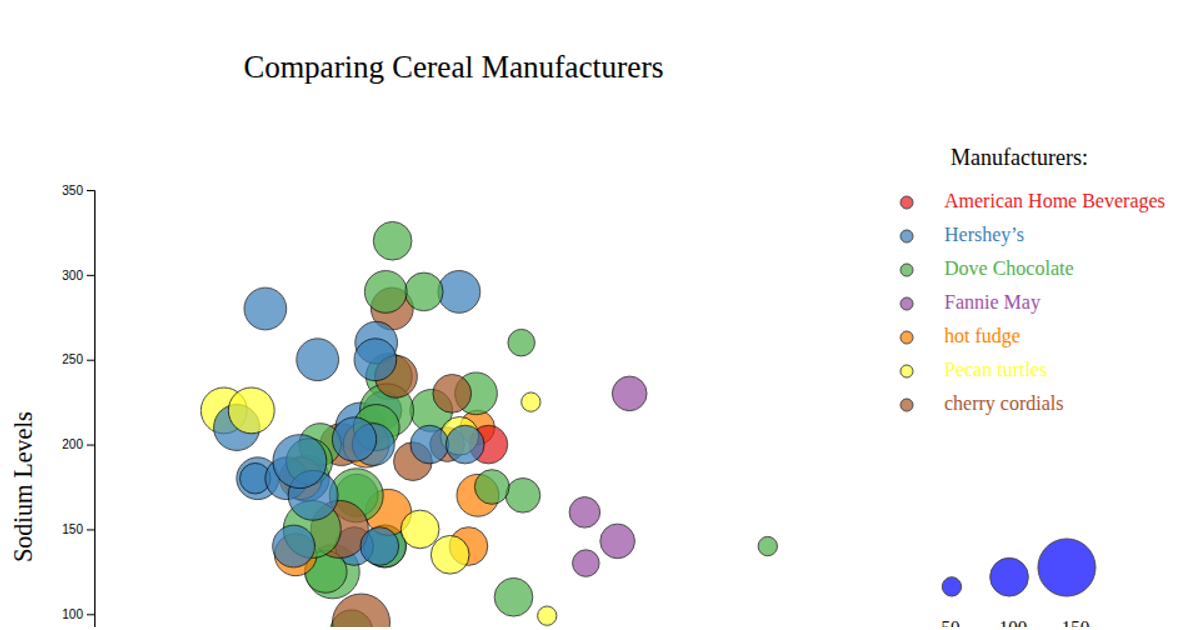
This bubble chart compares breakfast cereal manufacturers by plotting each product’s rating on the x-axis against its sodium level on the y-axis, with bubble size encoding calories and color distinguishing seven manufacturers. The visualization includes both size and color legends, plus labeled axes. Built with D3 v7, it uses `d3.scaleLinear` for positioning and radius, `d3.scaleOrdinal` with `d3.schemeSet1` for coloring, and renders circles as SVG elements loaded from a CSV file.
AI-generated descriptionMIT Licensed



Comments
Sign in to join the discussion.