🌍 Public
Tutorial2_Activity8
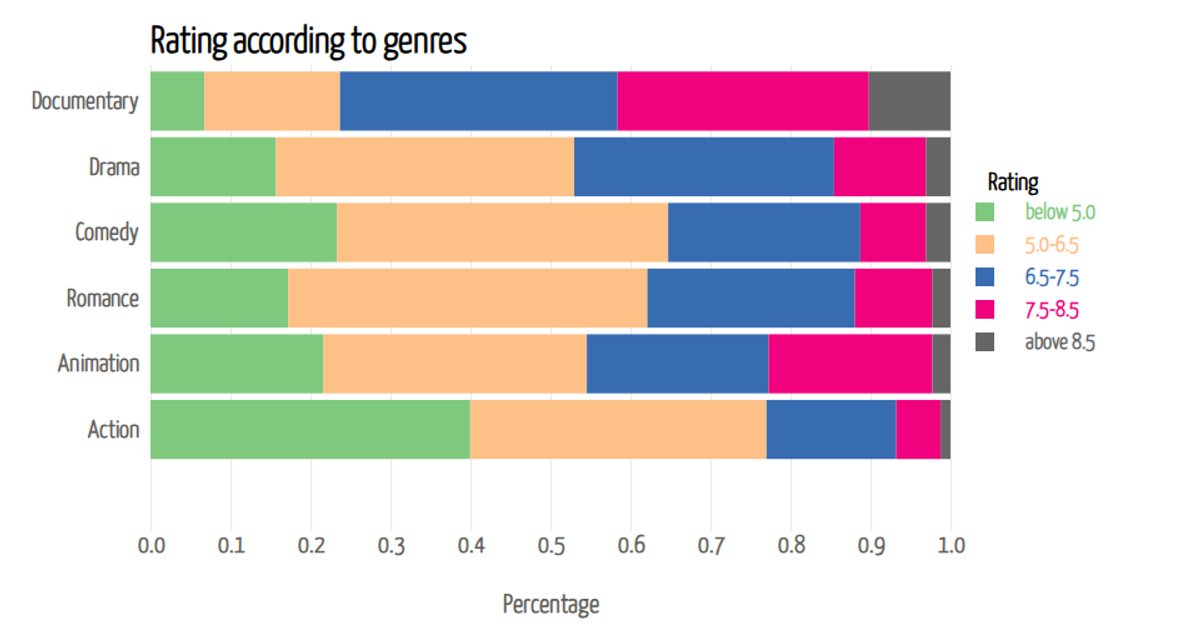
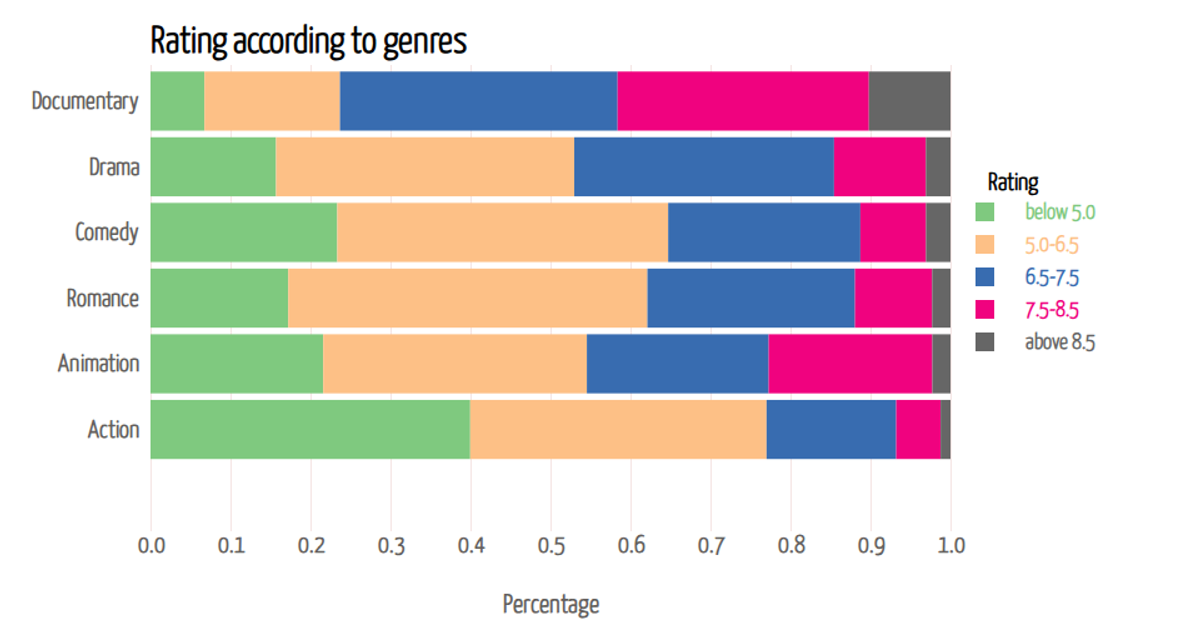
This example visualizes IMDb movie ratings across genres using a 100% stacked bar chart, where each horizontal bar shows the proportion of ratings falling into five categories from below 5.0 to above 8.5. The chart uses D3 v7’s `d3.stack()` to compute the stacked segments and `d3.scaleOrdinal` for color encoding, with axes rendered via `d3.axisBottom` and `d3.axisLeft`. Interactive tooltips appear on mouseover, displaying the exact percentage for each rating category, while the data comes from a local CSV file loaded through D3’s data parsing methods.
AI-generated descriptionAn example showing the capabilities of VizHub:
- Loads D3 via UNPKG.
- Demonstrates use of
importfrom"d3". - Demonstrates use of
importfrom local ES6 modules.
MIT Licensed


Comments
Sign in to join the discussion.