🌍 Public
Fork of 3D Bar chart for Hotel Booking Availability
Kkakumanusreya
Last edited Apr 27, 2023
Created on Apr 27, 2023
Forked from 3D Bar chart for Hotel Booking Availability
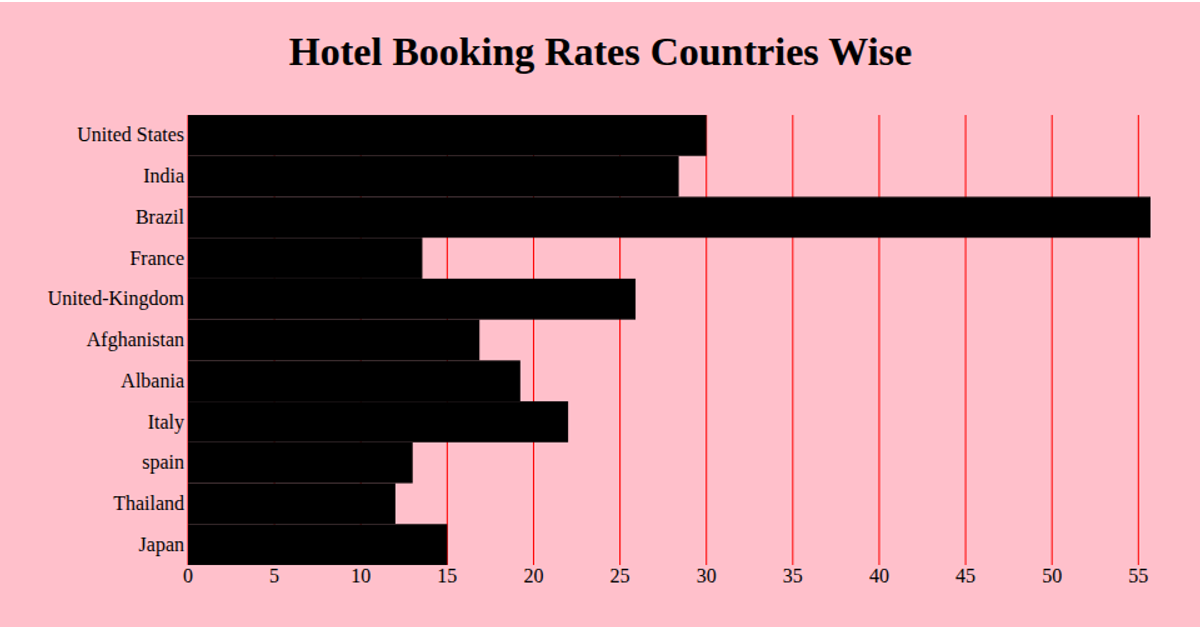
This example shows a 3D bar chart comparing hotel booking metrics across seven countries, including India, the United States, Brazil, and France. Five series—such as booking cancellation percentage, hotel closing rate, and hotel high availability—are grouped and stacked in a three-dimensional view. The chart is built using the Highcharts library with the highcharts-3d module, enabling rotation and depth through the options3d settings. Data is supplied as inline arrays per country, and axes are labeled to distinguish the booking metrics and sources. The background is set to pink via CSS.
AI-generated descriptionMIT Licensed







Comments
Sign in to join the discussion.