🌍 Public
Bar Chart
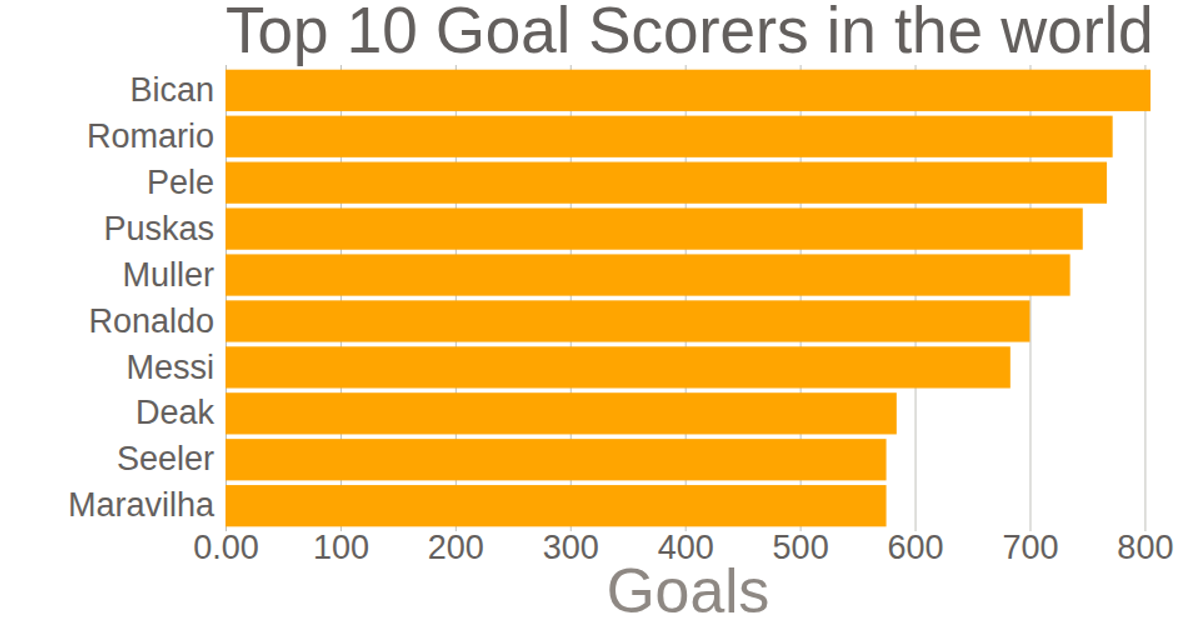
This example displays a bar chart of the top ten goal scorers for the Netherlands national football team, with player names on the y-axis and goal counts on the x-axis. The visualization uses D3 v5 to parse a CSV string with `csvParse`, transform the data, and render gold bars against a dark slate background. The chart includes styled axes, tick labels, and a title, all formatted via external CSS. The data originates from a hardcoded CSV in the source files, and the SVG rendering is handled entirely by D3’s standard plotting functions.
AI-generated descriptionMIT Licensed






Comments
Sign in to join the discussion.