JSON Fork of Ogelo - D3 Bar Chart
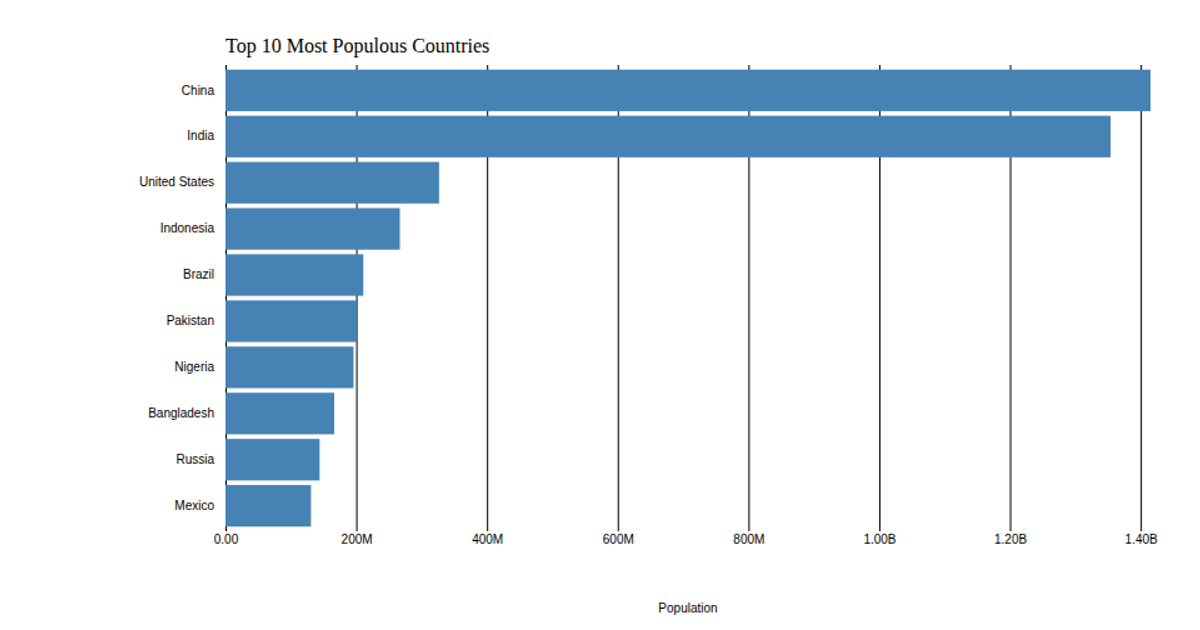
This bar chart displays the population of the top 10 most populous countries, using 2018 estimates from the United Nations World Population Prospects. The visualization sorts countries along a vertical band scale, with horizontal bar lengths proportional to population values. It uses d3.csv to load the data and d3.scaleLinear and d3.scaleBand for scaling, with d3.axisLeft and d3.axisBottom rendering the axes. The chart is drawn as SVG rectangles with a steelblue fill, demonstrating custom axis configuration and data-driven sizing through D3 v5.
AI-generated descriptionThis bar chart shows population of the top 10 most populous countries. The data comes from the year 2018 estimate in United Nations: World Population Prospects 2017. It also demonstrates customization of D3 axes.



Comments
Sign in to join the discussion.