🌍 Public
Fork of World countries tree
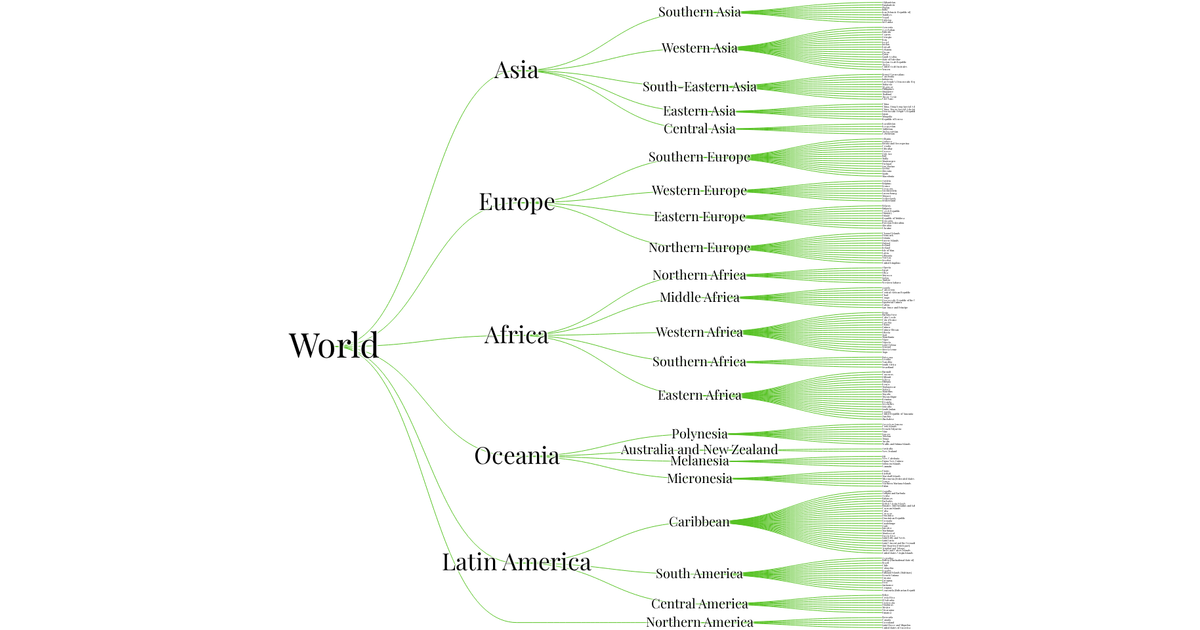
This example presents a hierarchical tree of world countries, with nodes arranged using a cluster layout from D3 v5. The visualization uses data2.json to display branches for continents and regions, with leaf nodes styled as colored rectangles scaled by percentage values. D3's `d3.cluster()` and `d3.hierarchy()` arrange the tree structure, while `d3.scaleLinear()` maps data values to rectangle heights. Text elements list category names, percentages, and associated keywords for each leaf, all rendered as SVG. Zooming and panning are enabled via `d3.zoom()`.
AI-generated descriptionAn example showing the capabilities of VizHub:
- Loads D3 via UNPKG.
- Demonstrates use of
importfrom"d3". - Demonstrates use of
importfrom local ES6 modules.
MIT Licensed




Comments
Sign in to join the discussion.