🌍 Public
hehehe
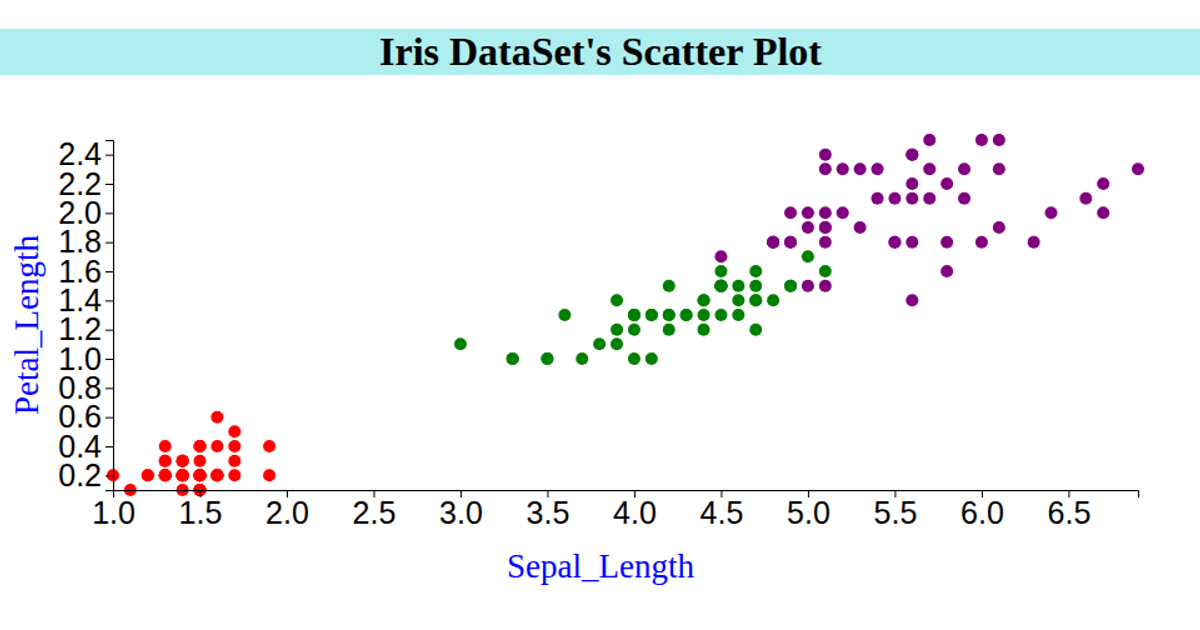
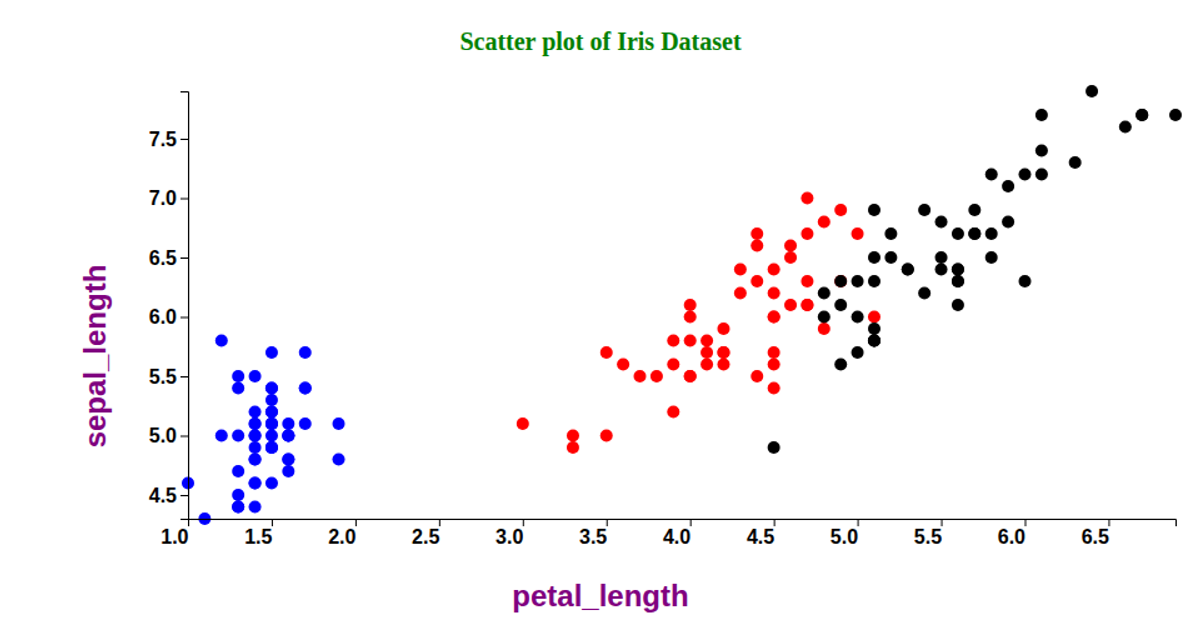
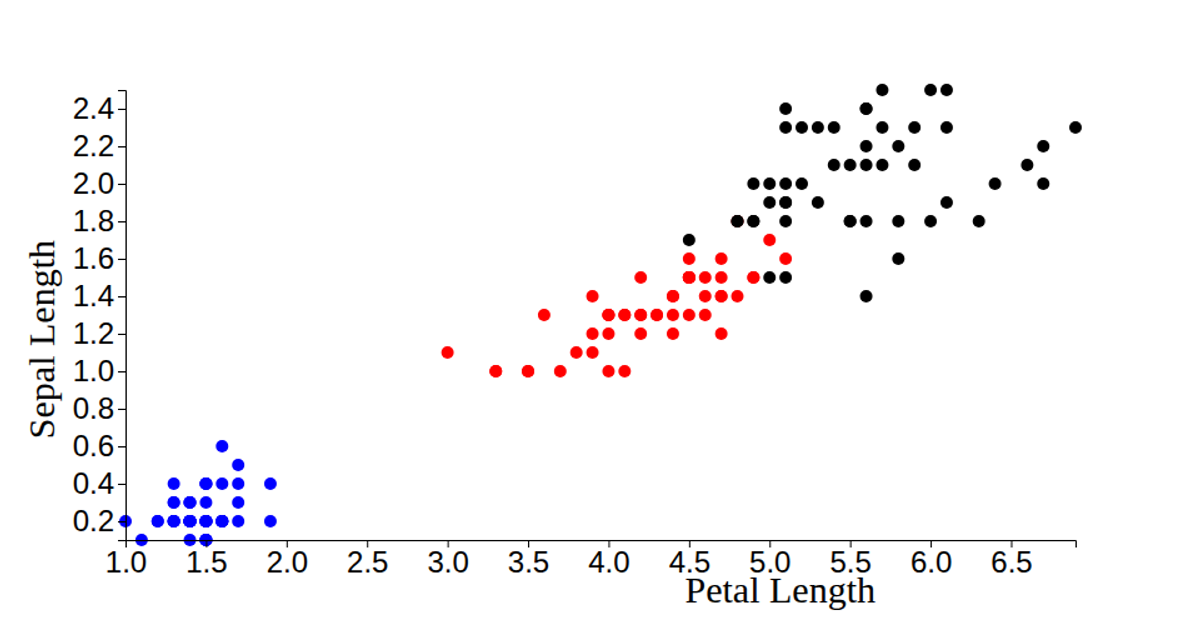
This scatter plot visualizes the Iris dataset, mapping petal length on the y-axis and sepal length on the x-axis, with each point colored by species (setosa, versicolor, or virginica). The visualization loads CSV data via `d3.csv`, uses `d3.scaleLinear` and `d3.extent` to set scales, and renders circles as SVG elements with `d3.selectAll` and `.join`. Axis labels and ticks are generated using `d3.axisLeft` and `d3.axisBottom`, while the fixed radius and species-based fill colors highlight distribution patterns across the three flower types.
AI-generated descriptionWe are Displaying the IRIS dataset using Scatter plot.
MIT Licensed




Comments
Sign in to join the discussion.