🌍 Public
ice 7 Line chart Ar
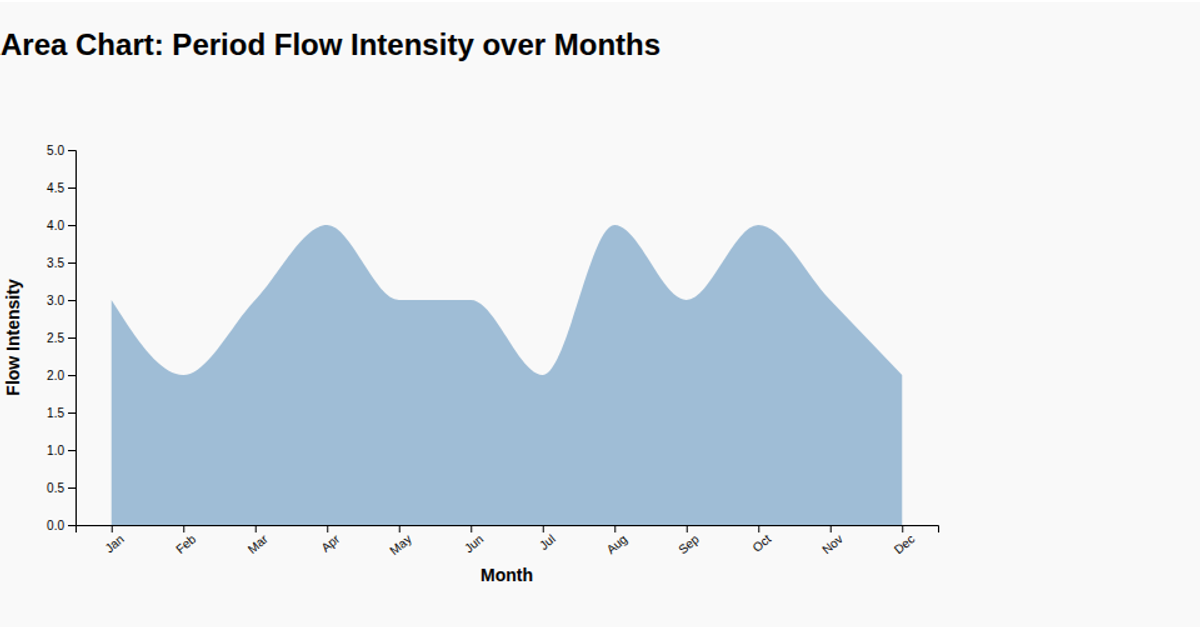
This chart tracks period flow intensity across the twelve months of the year, using a monotone-smoothed line and circular dots to highlight monthly values. Built with d3.v7 and rendered as SVG, the visualization maps month names along the x-axis and flow intensity on a fixed 0–5 scale. The line is generated with the `d3.line` API, while `d3.scalePoint` and `d3.scaleLinear` set the scales, and `d3.axisBottom` and `d3.axisLeft` produce the axes. The dataset is embedded directly in the script, showing a consistent pattern of intensity fluctuating between 2 and 4.
AI-generated descriptionMIT Licensed




Comments
Sign in to join the discussion.