🌍 Public
FHIV/AIDS Choropleth Map
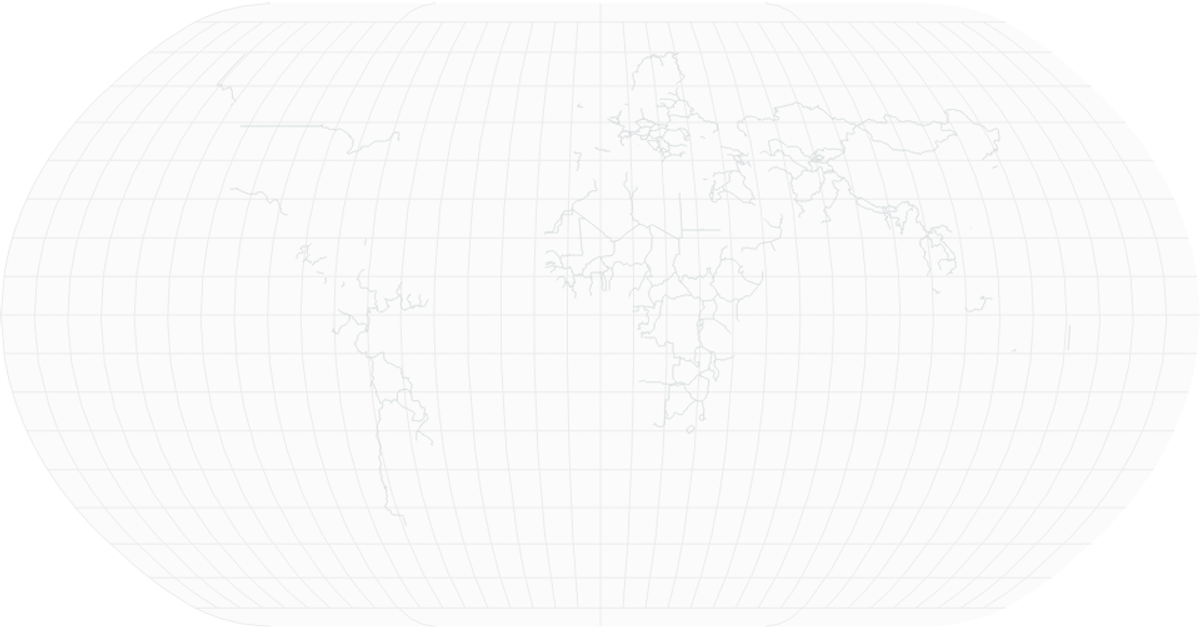
This choropleth map visualizes the global share of the population infected with HIV/AIDS in 2017, using a yellow-to-red sequential color scale to represent prevalence rates. Each country is filled according to its data value, with grey indicating missing data. The visualization leverages d3.geoPath and d3.geoNaturalEarth1 for map projections, d3.scaleSequential with d3.interpolateYlOrRd for color mapping, and React for rendering SVG elements. Data is loaded from CSV files via d3.csv.
AI-generated descriptionSmiley face implementation with React.
MIT Licensed




Comments
Sign in to join the discussion.