🌍 Public
Activity-8_Task2
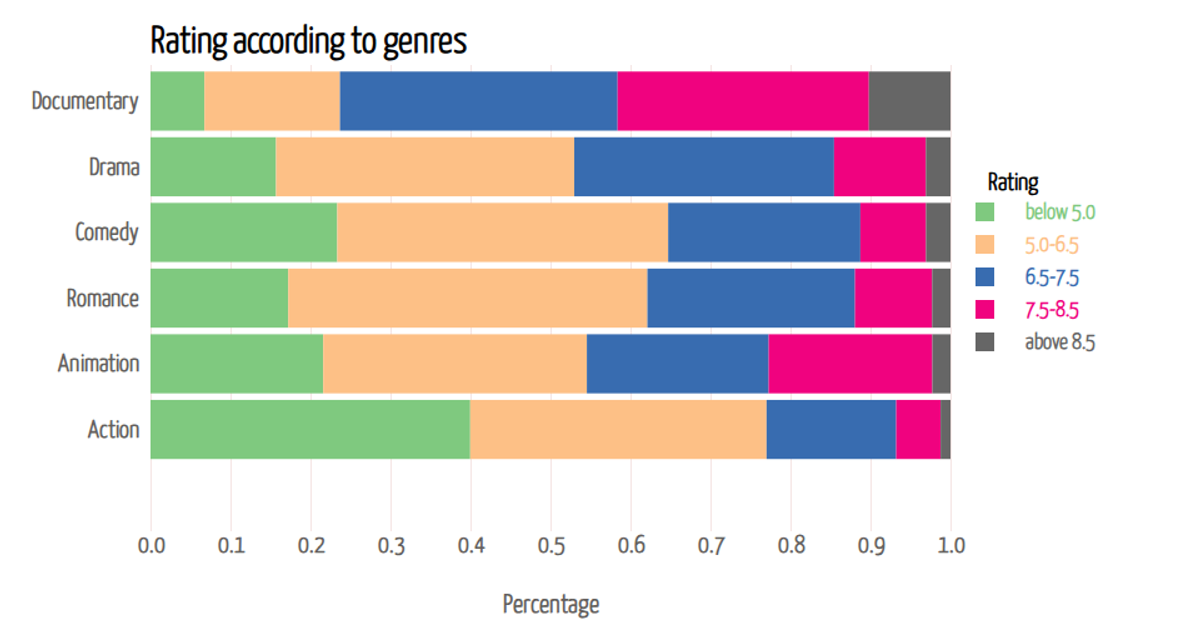
A horizontal stacked bar chart displays the distribution of IMDb movie ratings across six genres, with each bar segmented into five rating categories from below 5.0 to above 8.5. The chart uses d3.stack to compute the layered bar segments, d3.scaleBand for genres on the y-axis, and d3.scaleLinear for the percentage scale on the x-axis. Interactive tooltips appear on mouseover, showing the exact percentage for each genre-rating combination. Data comes from a CSV file loaded with d3.csv.
AI-generated descriptionAn example showing the capabilities of VizHub:
- Loads D3 via UNPKG.
- Demonstrates use of
importfrom"d3". - Demonstrates use of
importfrom local ES6 modules.
MIT Licensed




Comments
Sign in to join the discussion.