🌍 Public
Assignment 2 Question 2
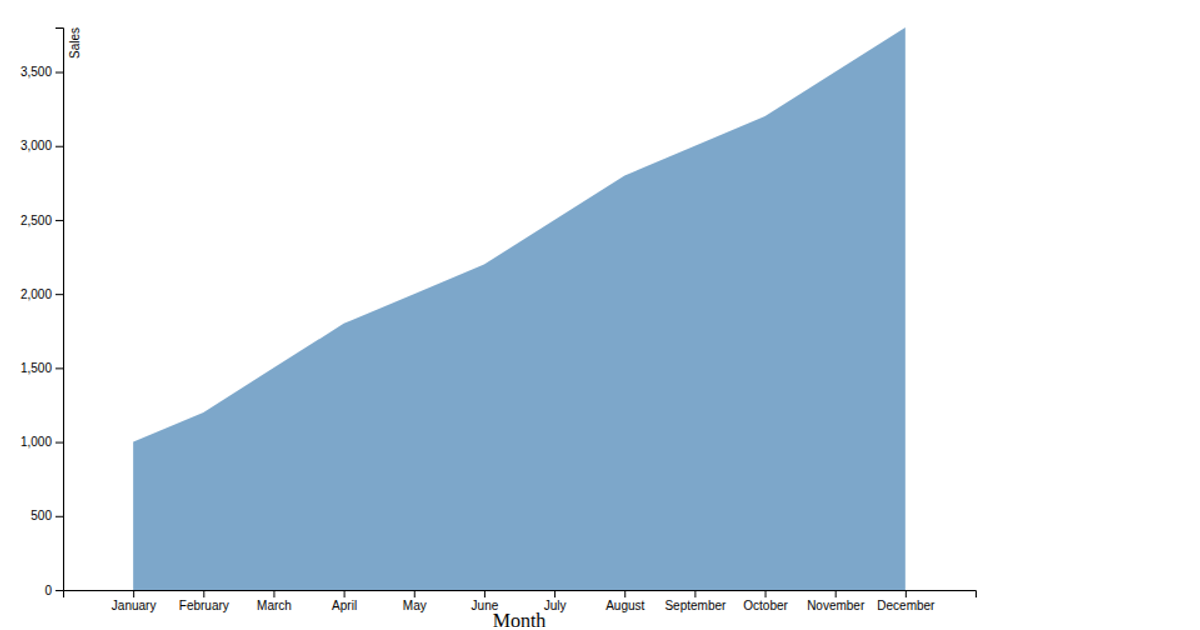
This visualization displays product weights as a filled area chart, with product names on the x-axis and weight values on the y-axis. The chart uses D3.js v7 with an SVG rendering approach, loading data from a CSV file via `d3.csv`. The area path is generated using `d3.area`, positioned with `d3.scaleBand` and `d3.scaleLinear`, while axes are drawn with `d3.axisBottom` and `d3.axisLeft`. Rotated x-axis labels and steelblue fill style the chart.
AI-generated descriptionMIT Licensed


Comments
Sign in to join the discussion.