🌍 Public
ice-8
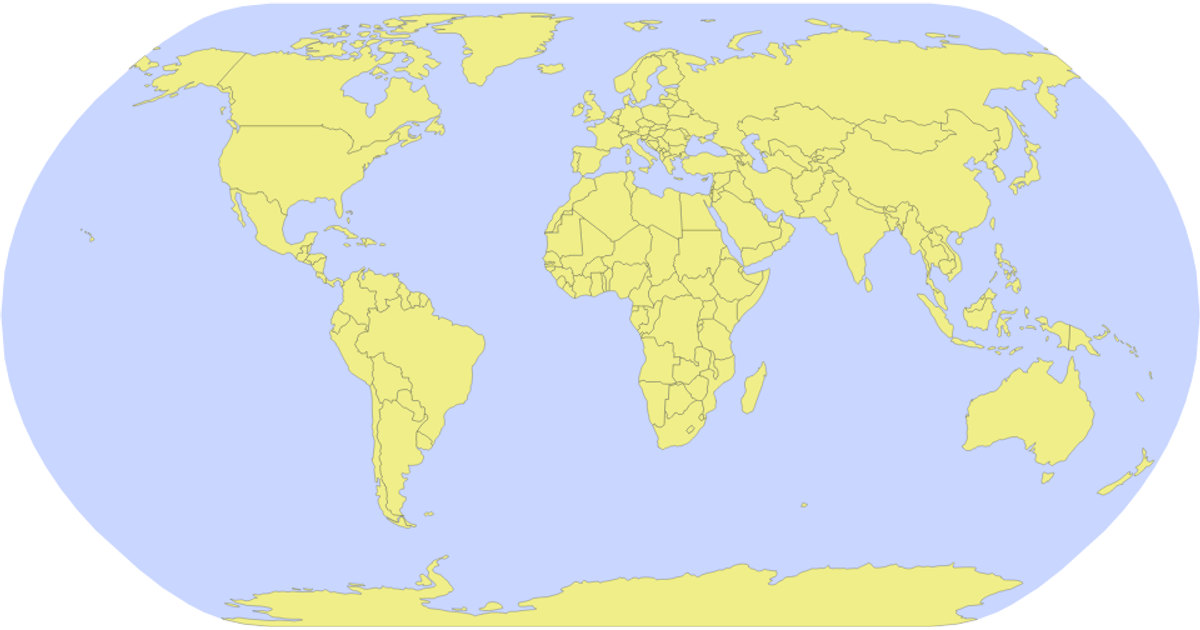
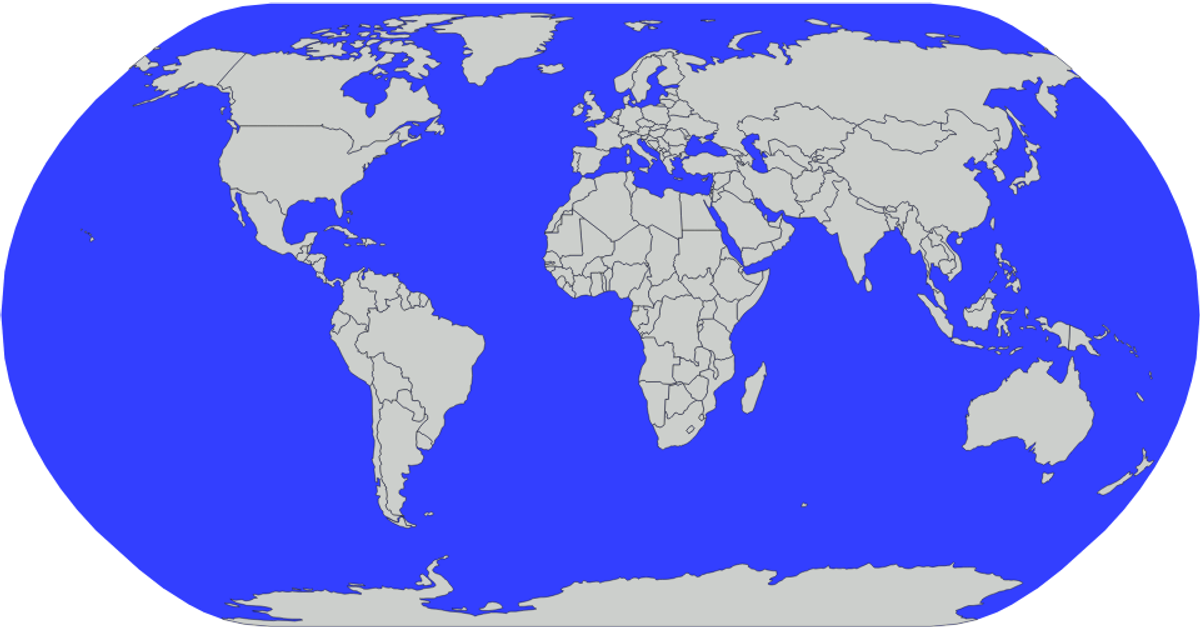
This example displays a world map using a Natural Earth projection, with countries rendered as semi-transparent yellow polygons over a light blue spherical backdrop. The visualization loads geographic data from the world-atlas JSON and processes it with the topojson library’s feature method. The map is drawn by generating SVG paths via d3.geoPath and the geoNaturalEarth1 projection, while the sphere outline is created from an explicit Sphere geometry. The d3 select and append methods build the SVG hierarchy, with CSS classes styling the sphere and country fills.
AI-generated descriptionMIT Licensed


Comments
Sign in to join the discussion.