🌍 Public
ICE-8:World Map of Different cites and Loacations
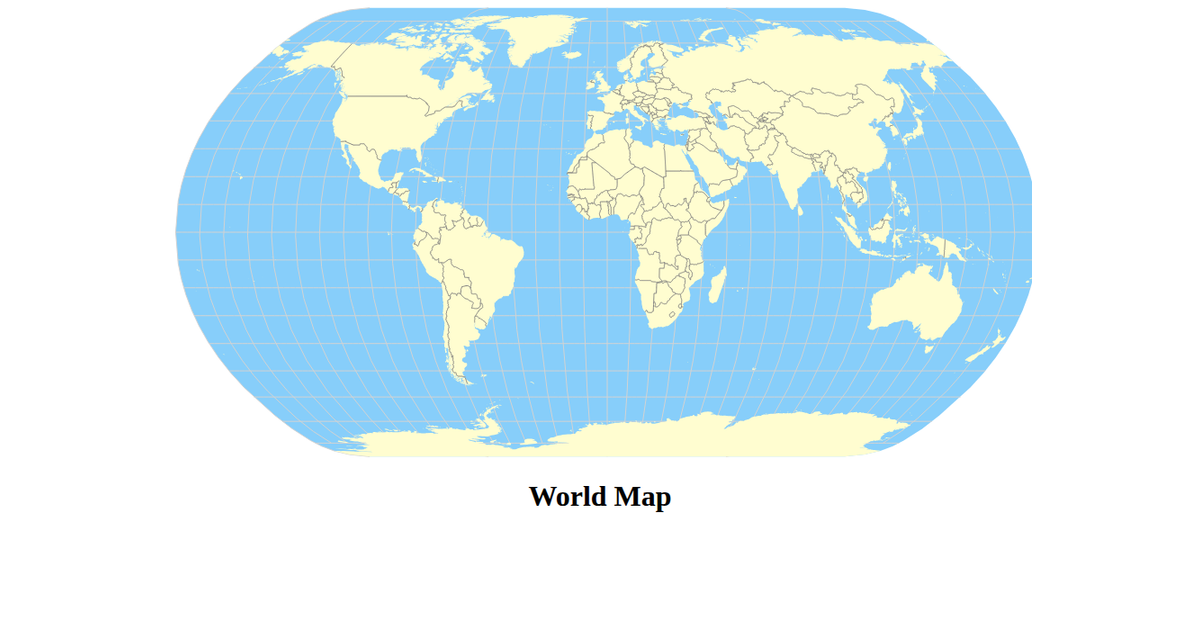
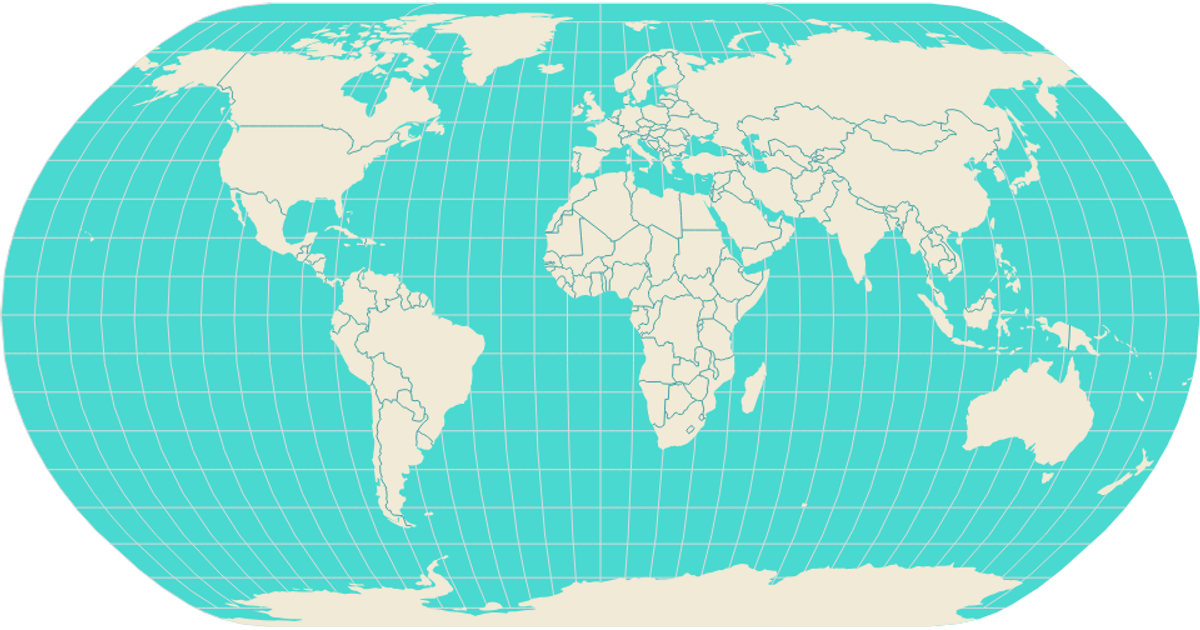
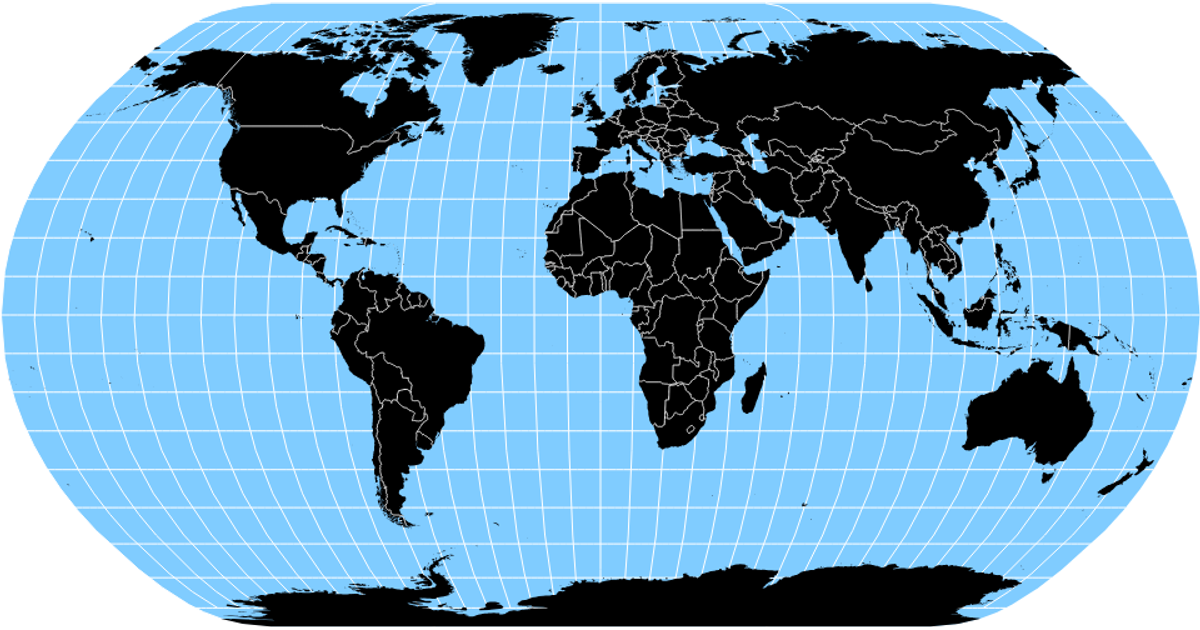
This map visualizes global population distribution across cities, using circle size to represent relative population counts on an equal-area projection. Built with React and D3, the example loads world land geometries and city coordinates, then renders landmasses, graticules, and sphere boundaries via `d3.geoPath` and `d3.geoNaturalEarth1`. City data is fetched as CSV and processed with `d3.csv`, with circle radii scaled by the square root of population. The visualization uses SVG output, with styling defined in CSS for land, ocean, and city markers.
AI-generated descriptionA program that loads in some data CSS Named Colors using D3 utilities and uses React state to Keep track of the data.
MIT Licensed





Comments
Sign in to join the discussion.