🌍 Public
Reusable Scatter plot Archana Goli
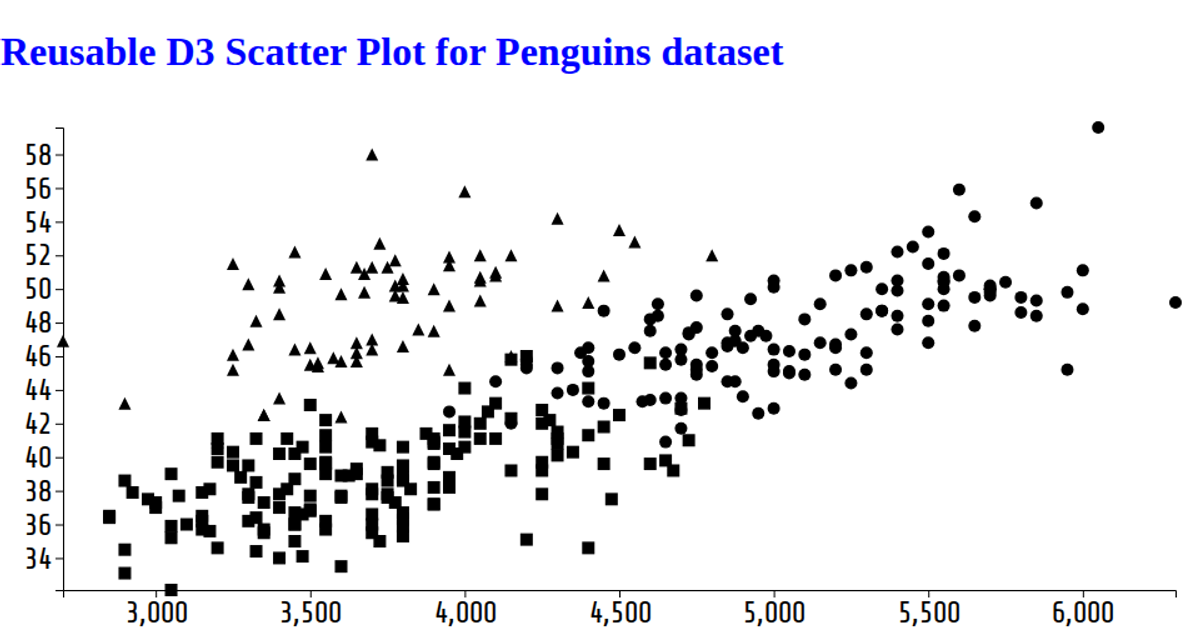
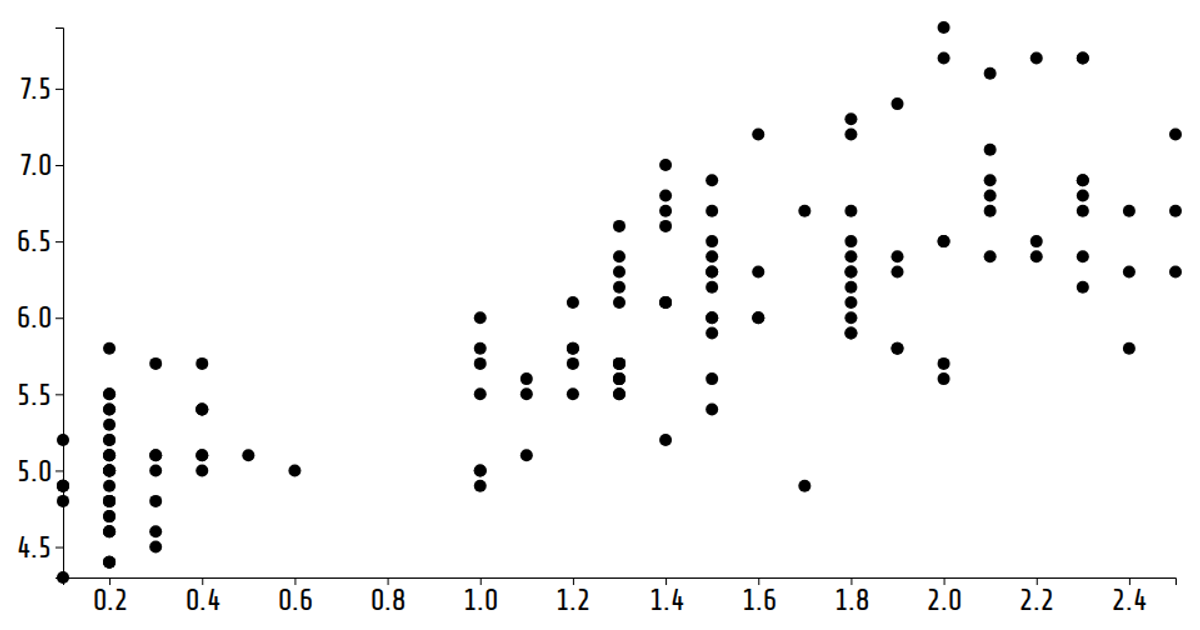
This reusable D3.js scatter plot visualizes the dimensions of wheat kernels, with each circle representing a sample. The plot cycles through four variables—Perimeter, Kernel_Width, Area, and Kernel_Length—on the x-axis every two seconds, while the y-axis remains Kernel_Length. Built with D3’s `scaleLinear`, `axisLeft`, and `axisBottom` APIs, the SVG visualization updates dynamically via a `setInterval` function. The code loads CSV data from a GitHub gist and renders animated, resizable scatter plots based on the browser window’s dimensions.
AI-generated descriptionA reusable scatter plot for the data set: https://gist.githubusercontent.com/ArchanaGoli/a612028a1c06123b8ec03ffa58089631/raw/01855a581adcb624ac28fd3c63817e0aa7af858b/gistfile1.txt
MIT Licensed




Comments
Sign in to join the discussion.