🌍 Public
Fork of Area_Chart
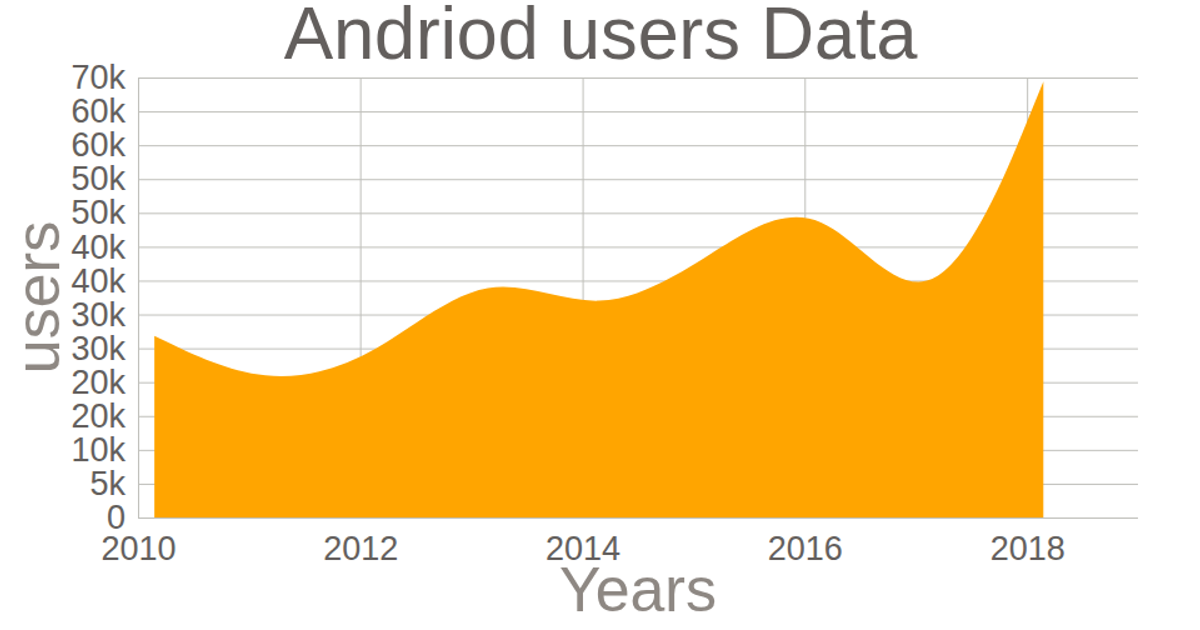
This area chart displays the annual number of WhatsApp users from 2008 to 2017, with the data loaded from a CSV file via `d3.csv`. The visualization combines a black line, drawn with `d3.line` and `curveBasis`, over a green filled area generated by `d3.area`, both using `d3.scaleLinear` for the axes. The SVG rendering includes styled tick marks and labels, with axis labels positioned via `d3.axisBottom` and `d3.axisLeft`.
AI-generated descriptioncombined line and area charts
MIT Licensed



Comments
Sign in to join the discussion.